Posts
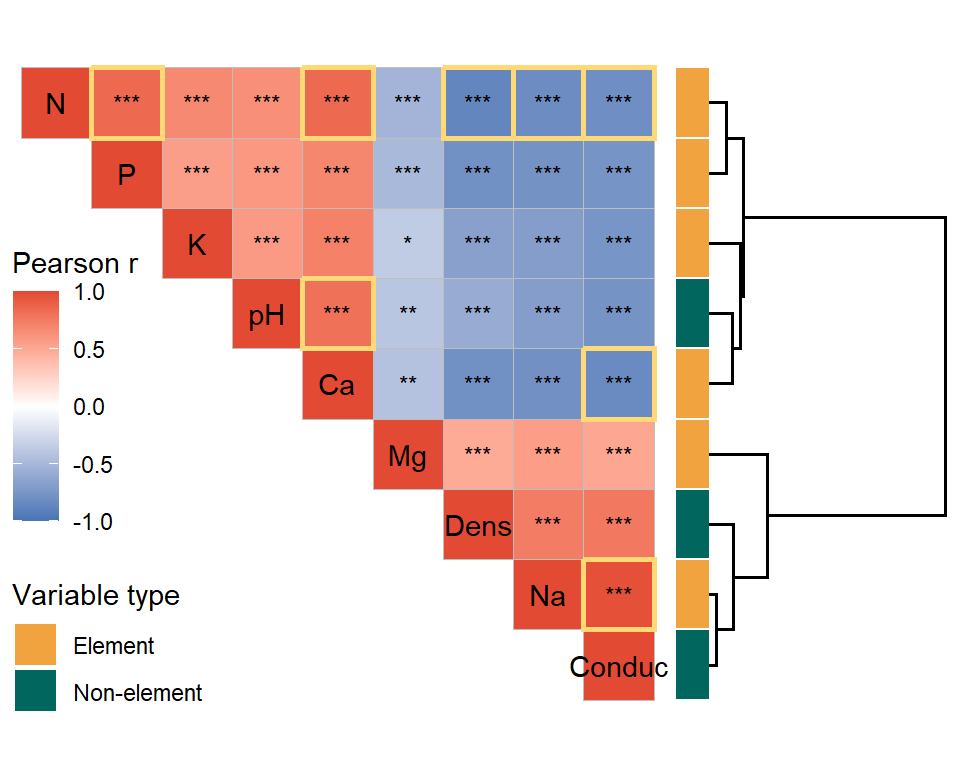
Post #43. Pair them up—creating scatterplot matrices and correlation heatmaps in ggplots
In this post, you will learn how to create awesome scatterplot matrices and correlation heatmaps in ggplots using the packages `GGally` and `ggcorheatmap`!
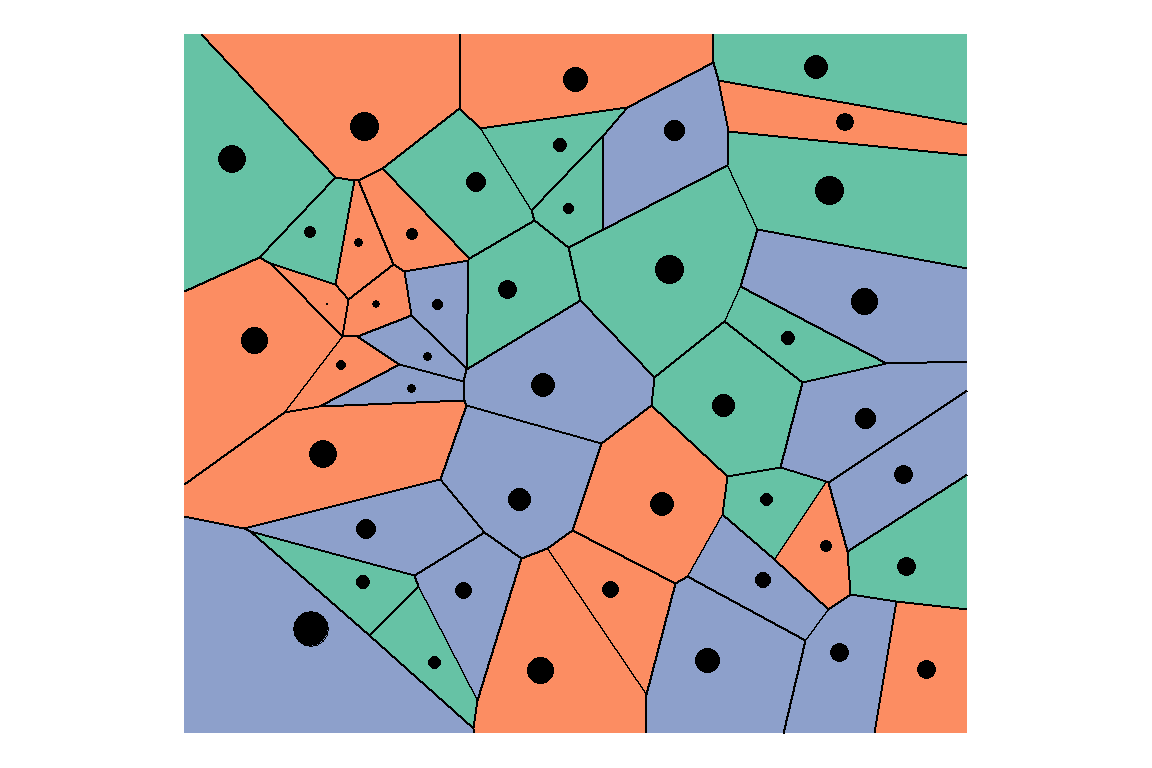
Post #42. Accelerate your ggplots with the extension package "ggforce"
Come take a look at some cool ggforce functions that can help strengthen your ggplot visualization!
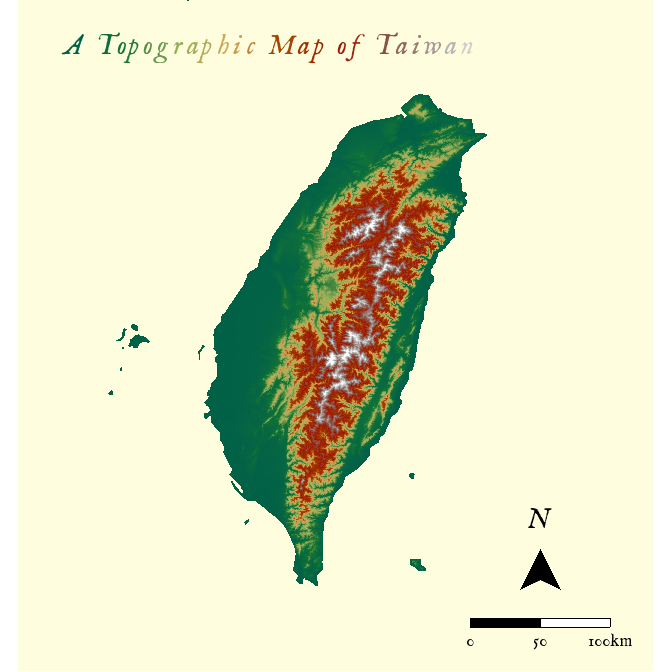
Post #41. ggplot Map Series No.7: Spatial raster maps in ggplot
In this post, we will explore how to create maps in ggplot using spatial raster data!
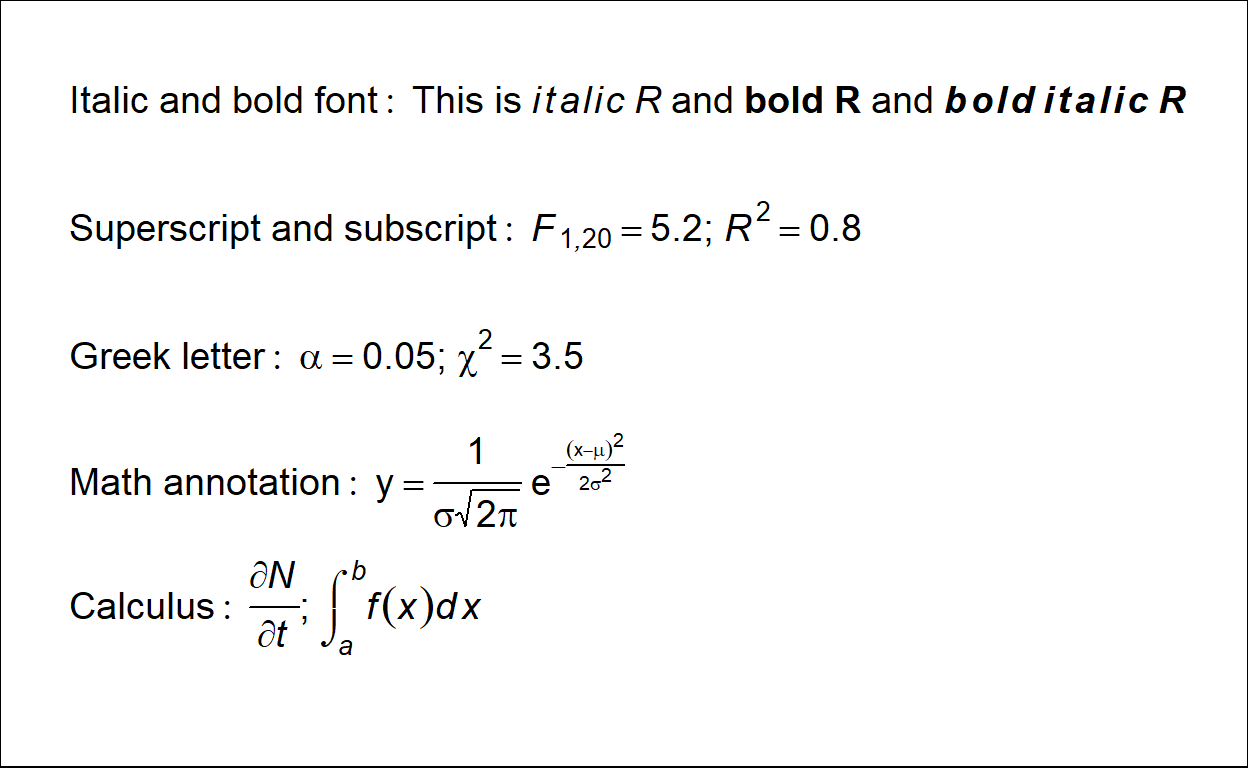
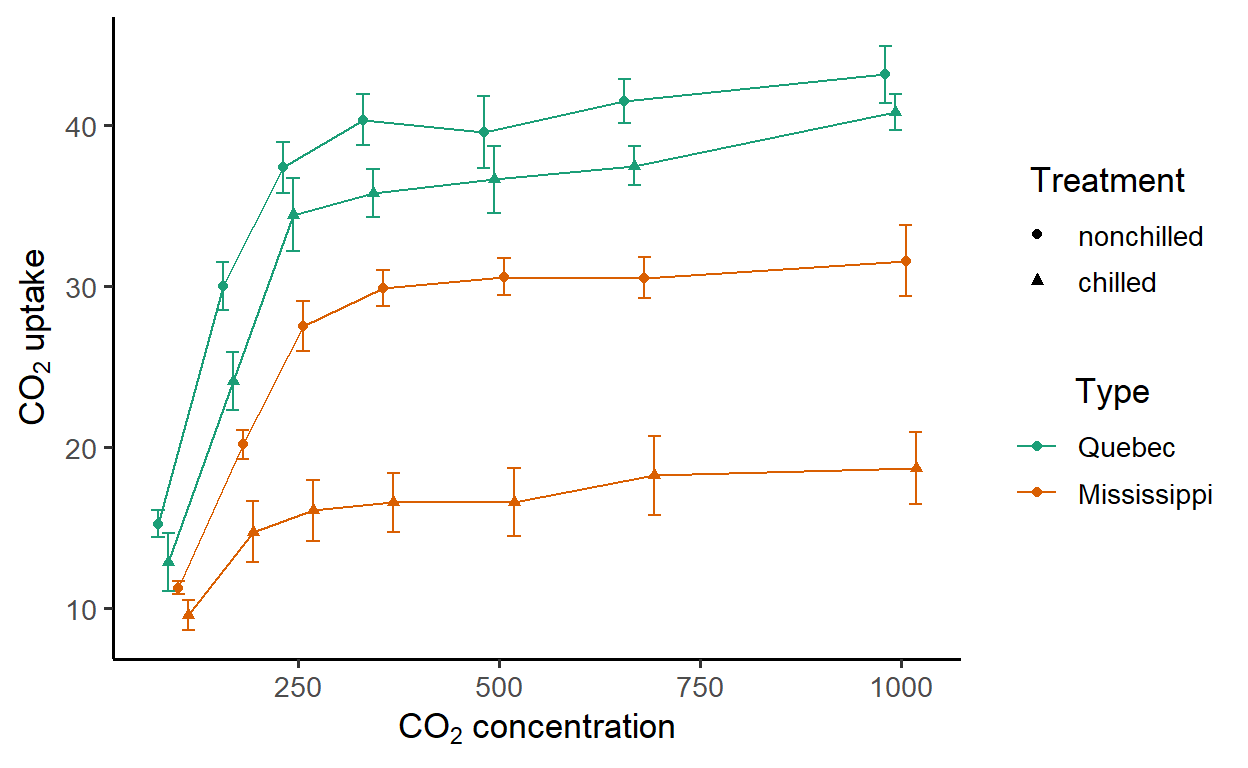
Post #40. Mathematical expressions in ggplots
Come and learn some quick tips for adding mathematical expressions in ggplots!
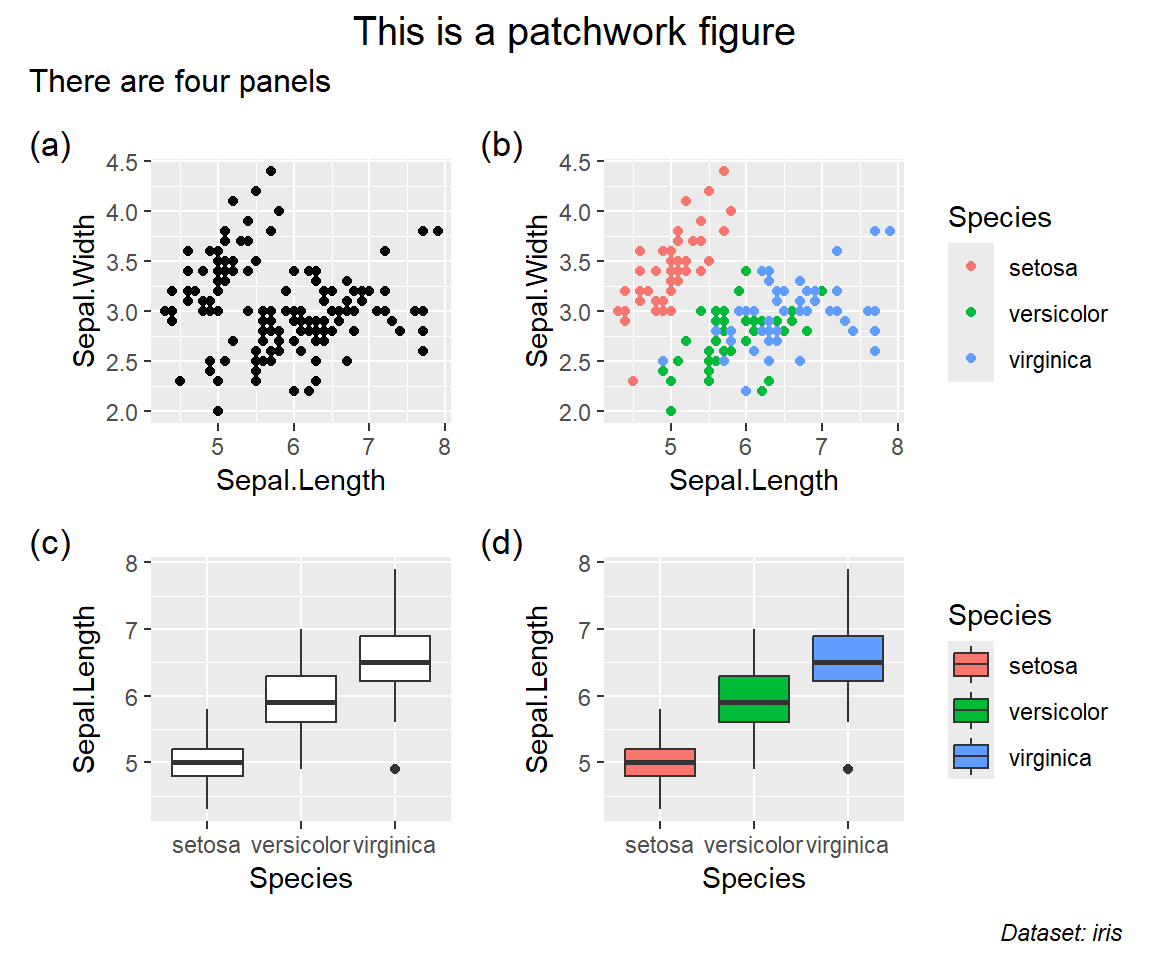
Post #39. Lay them out—arranging multiple ggplots with `patchwork`
In this post, you will learn the nuts and bolts of arranging multiple ggplots with the package `patchwork`!
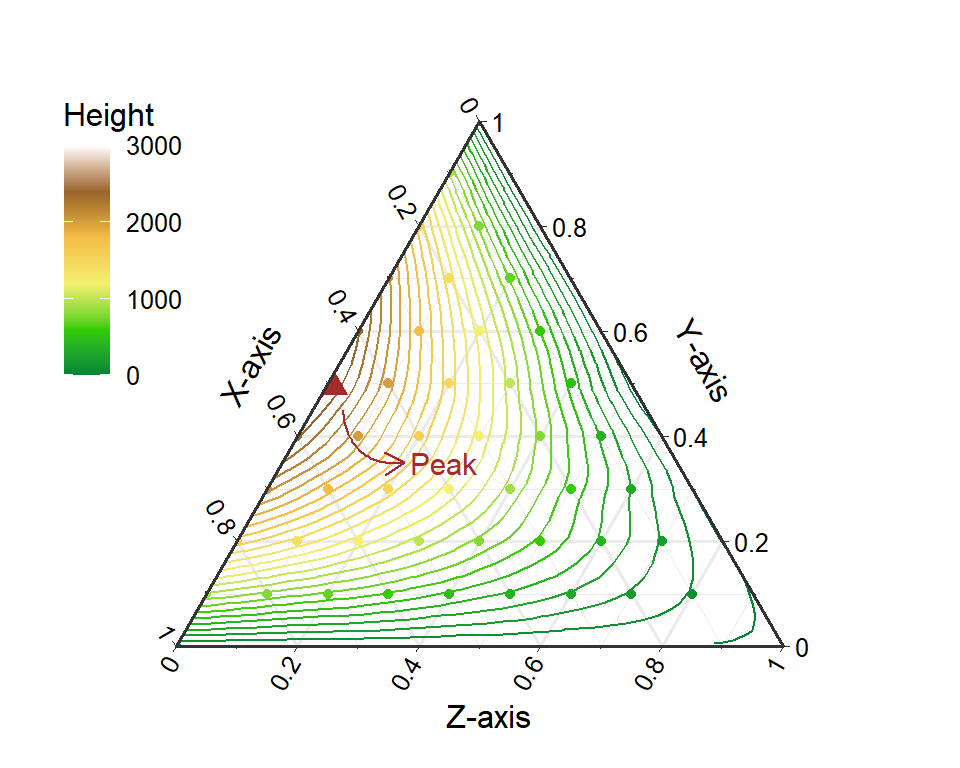
Post #38. Creating ternary plots with `ggtern`
Come and learn some useful tips for creating ternary plots in ggplot!
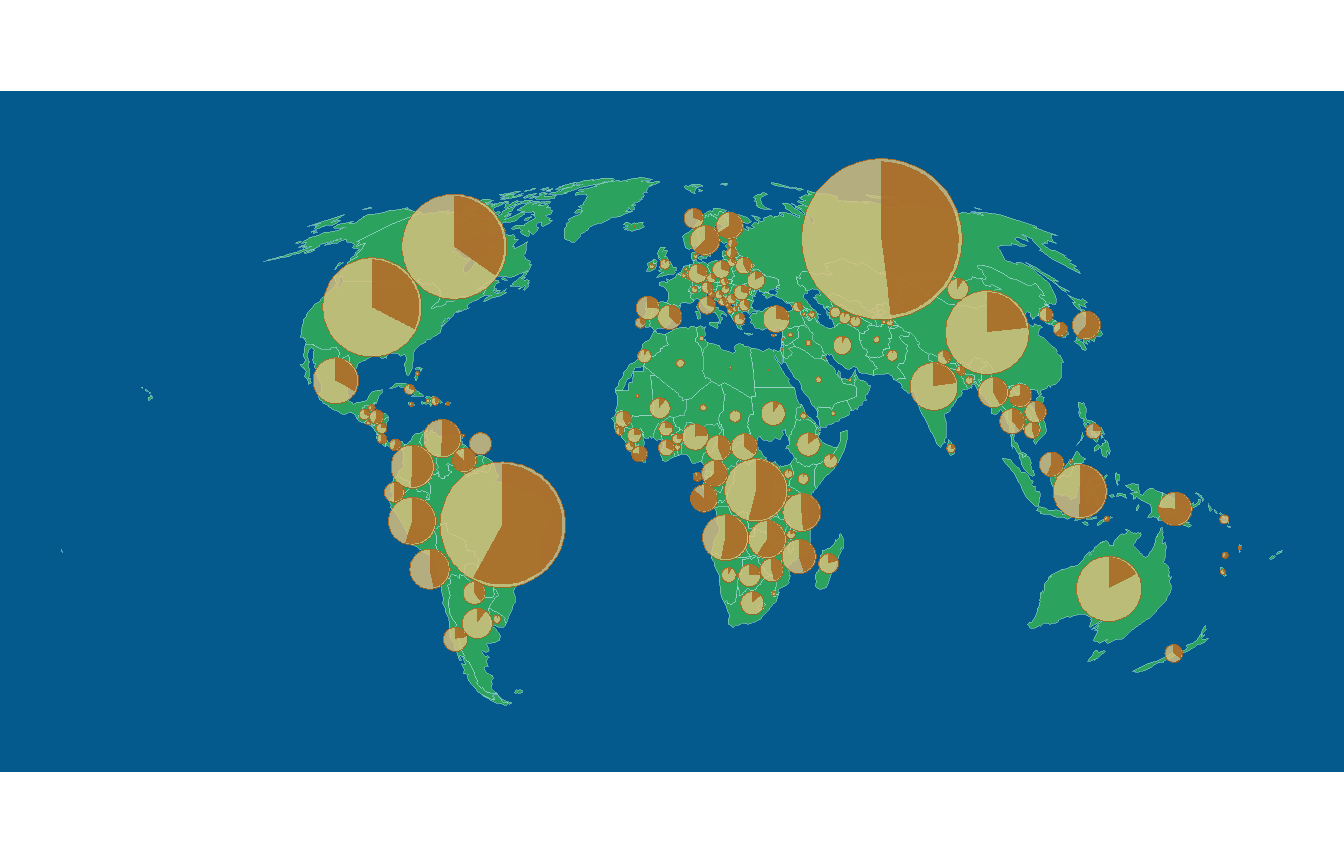
Post #37. ggplot Map Series No.6: Cartograms in ggplot
Come and learn how to create cartograms in ggplot!
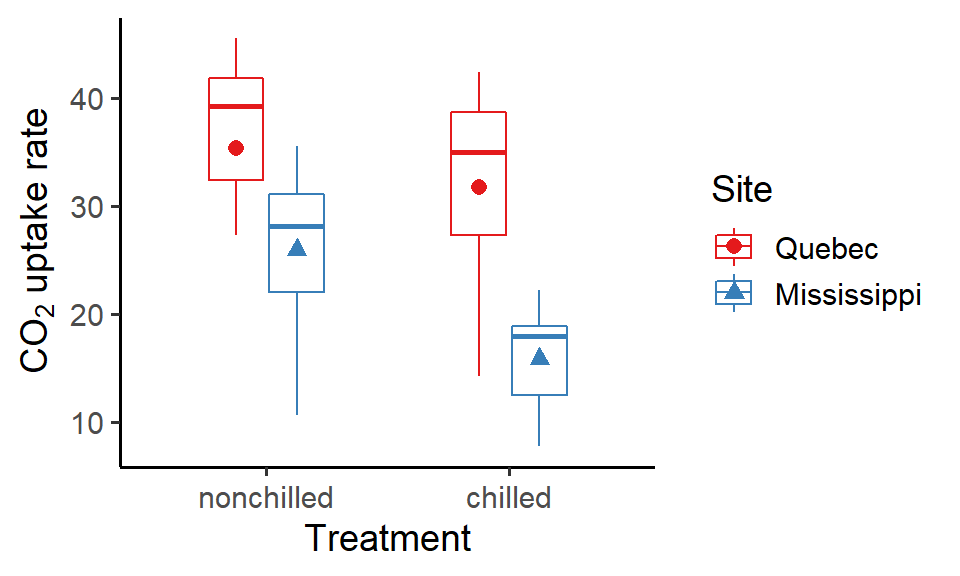
Post #36. The nitty-gritty of dodging in ggplots
Here come the useful tips for dodging in ggplots!
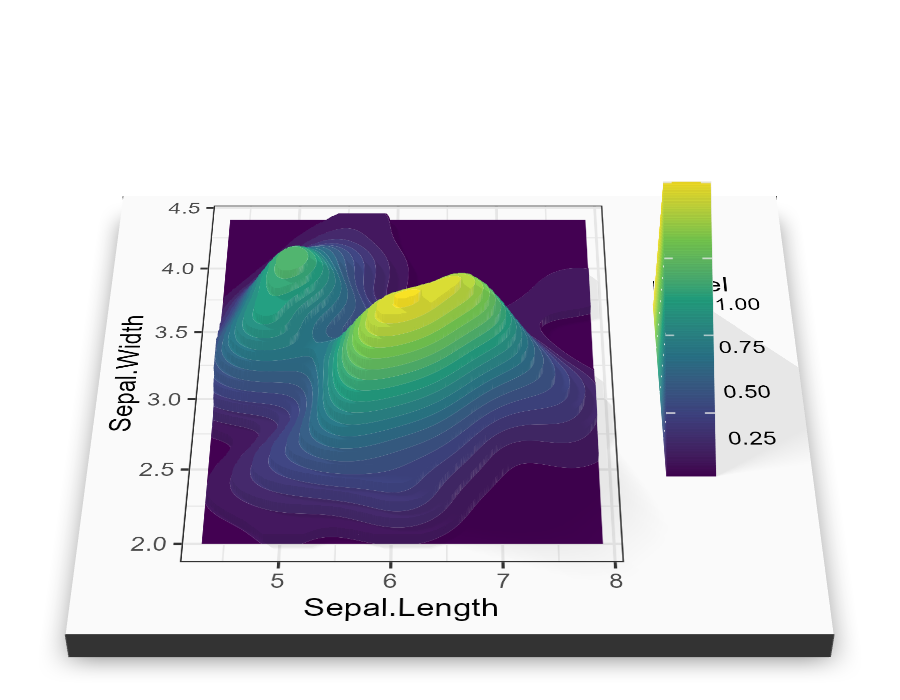
Post #35. Creating 3D plots with plotly and rayshader
Bring your plots to the next dimension with `plotly` and `rayshader`!
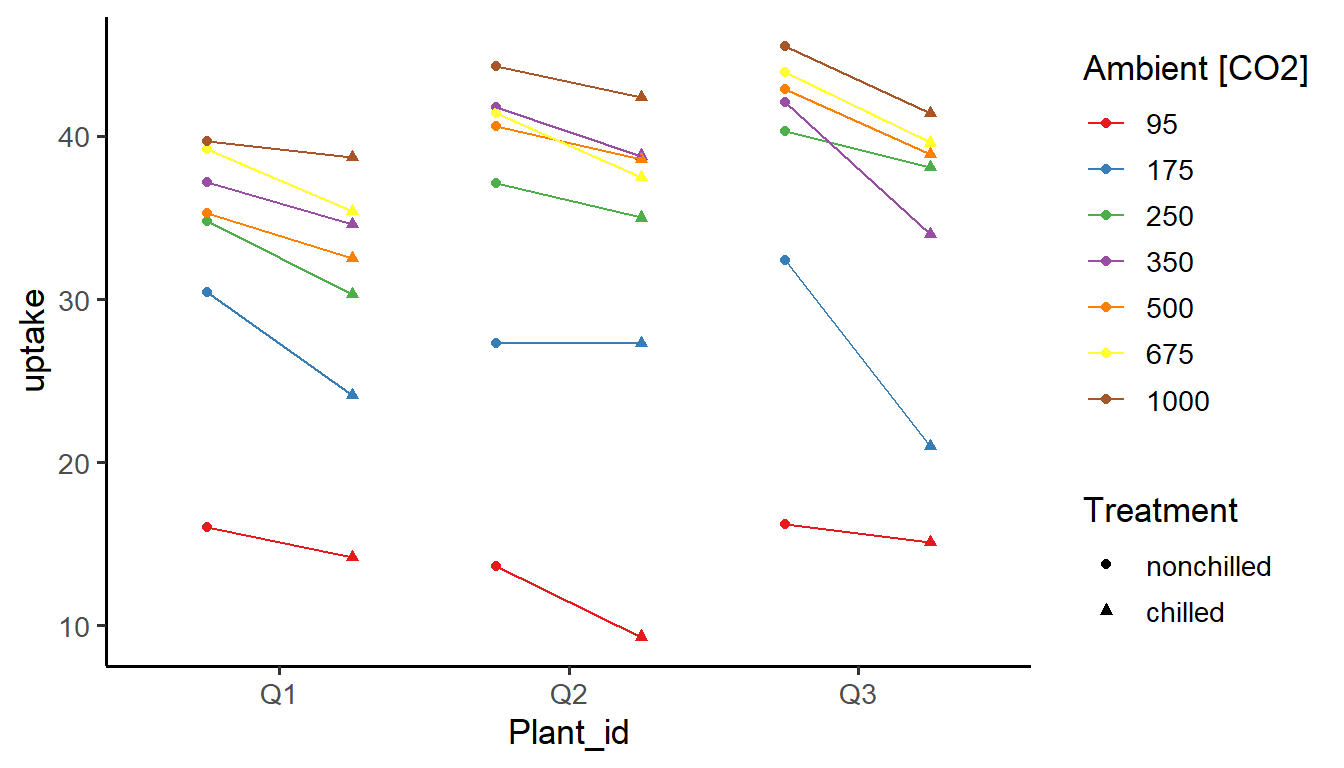
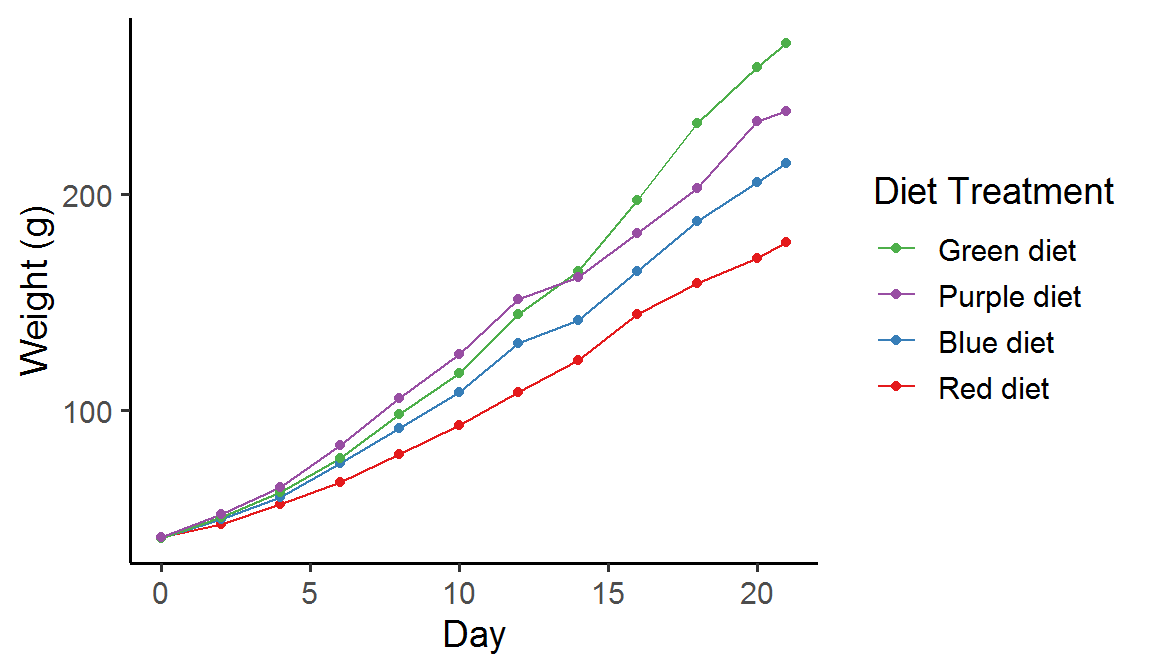
Post #34. Connecting paired points in ggplots
Check out the handy tips for connecting paired points in ggplots!
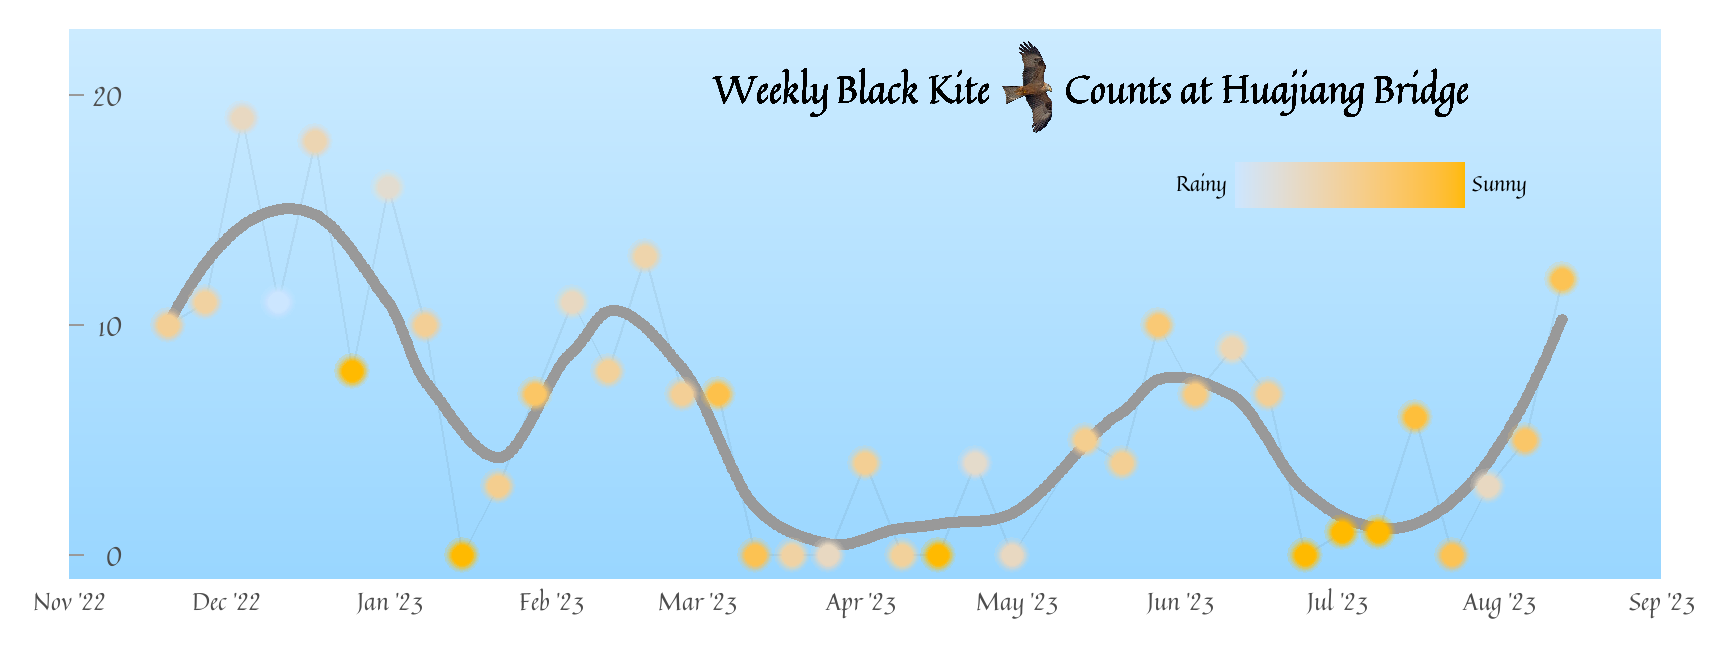
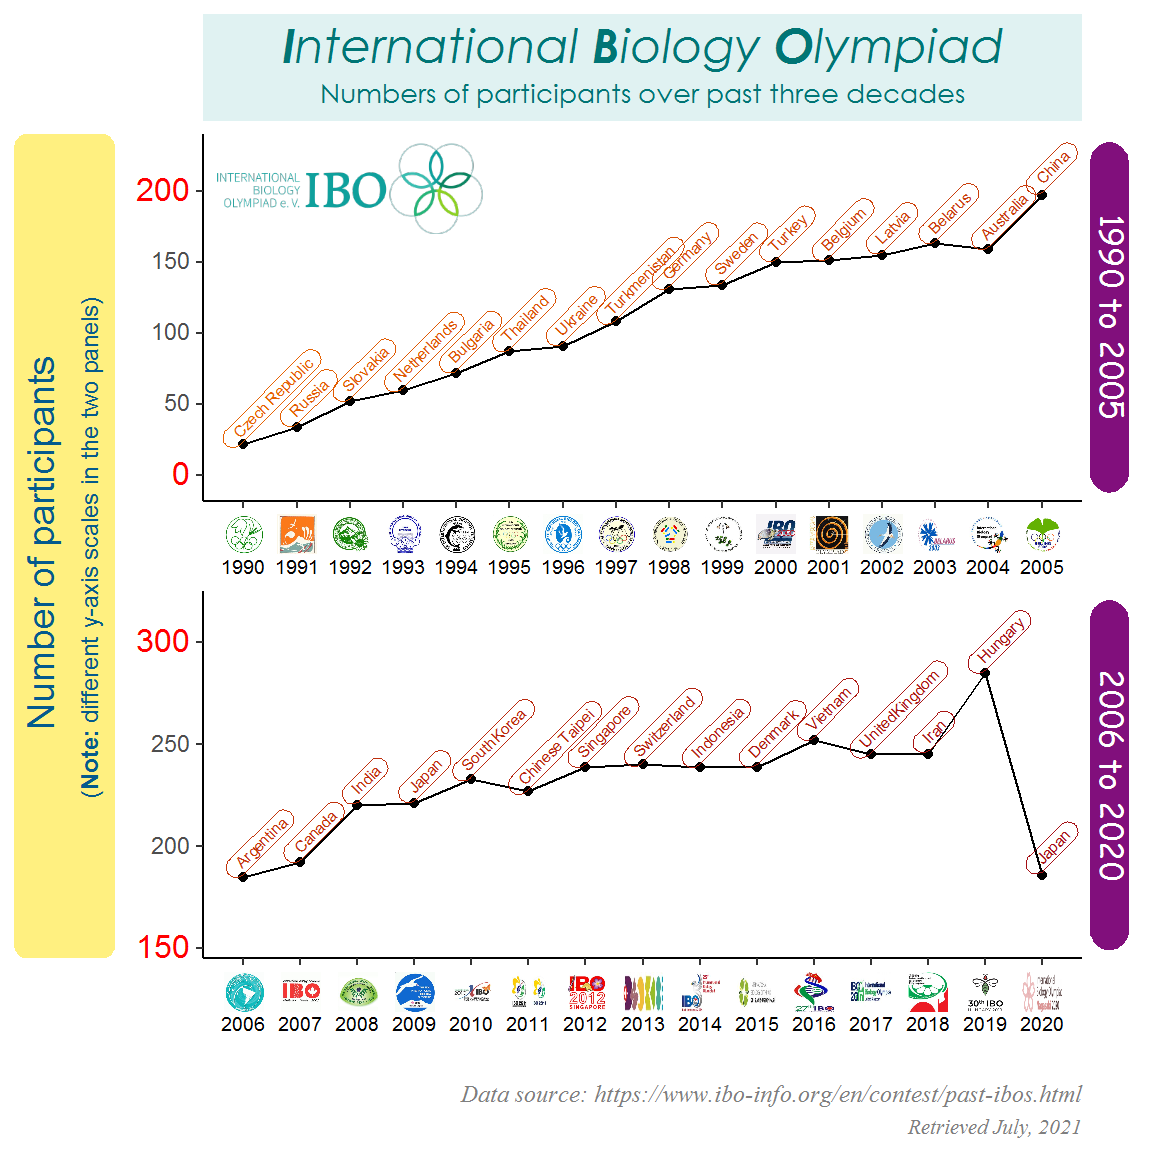
Post #33. A "timely" plot—Visualizing time series data in ggplot
Let's create an awesome time series chart in ggplot!
Post #32. ggplot Map Series No.5: Scale bar and north arrow with `ggsn`
Enhance your map with a scale bar and a north arrow using the package `ggsn`!

Post #31. From static to dynamic—Create ggplot animations by hand
Read more here to bring your plots alive!
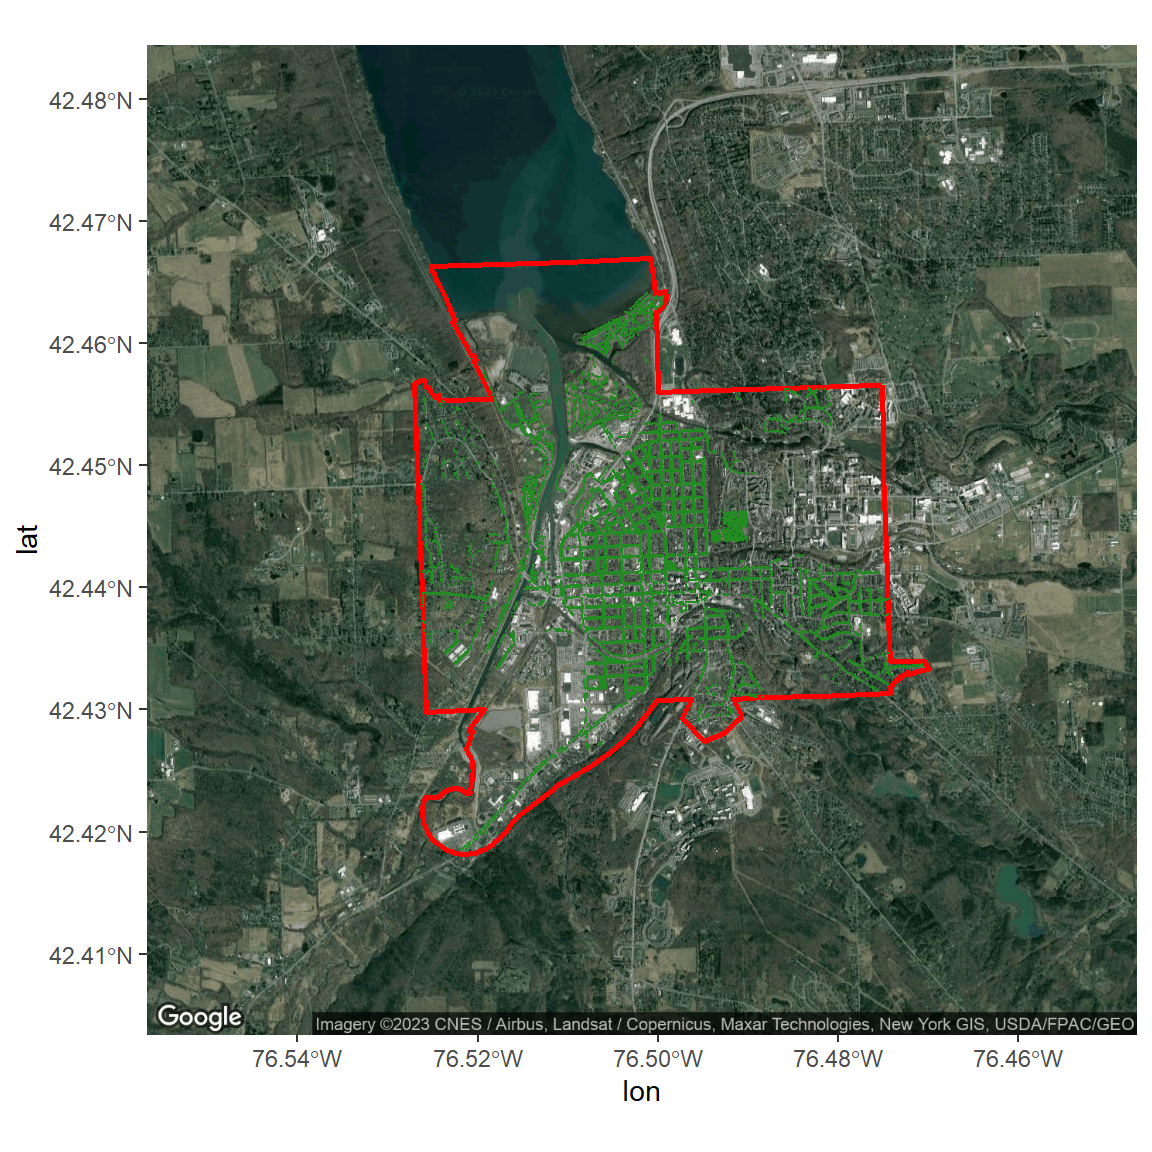
Post #30. ggplot Map Series No.4: Google Maps in R with `ggmap`
A quick three-minute post on creating maps using Google Maps tiles with the package `ggmap`.
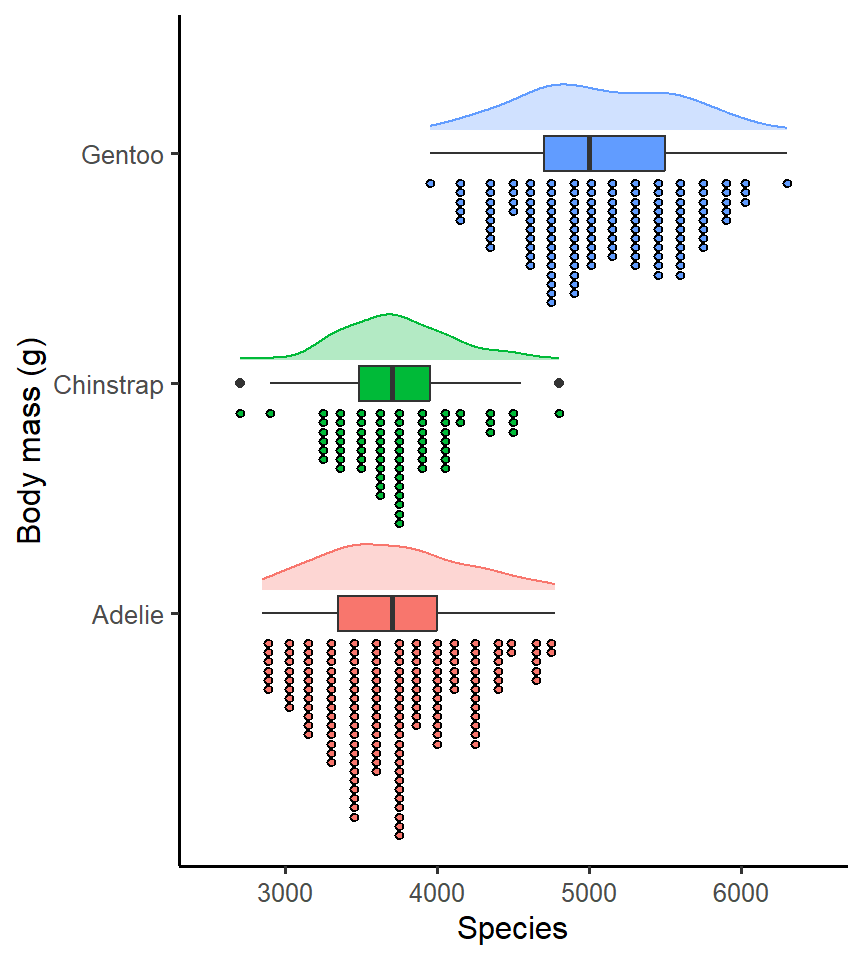
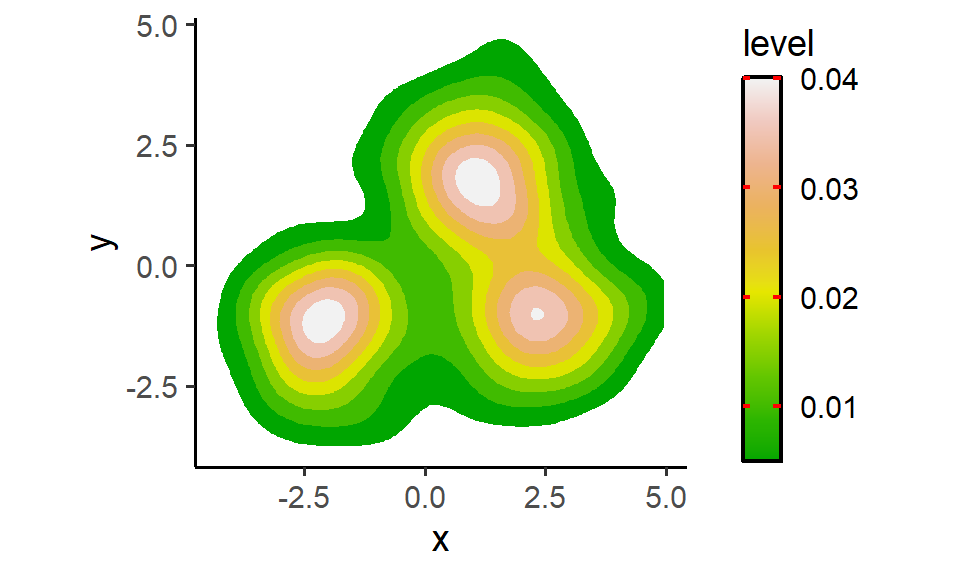
Post #29. Bad weather today—Creating raincloud plots in ggplots
Come and learn how to create raincloud plots in ggplots to make your data "shine"!
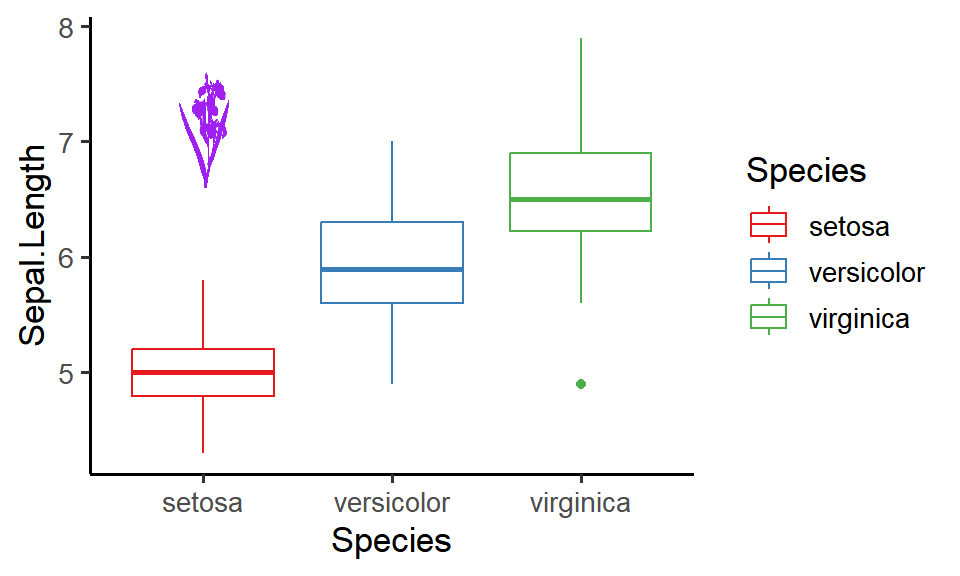
Post #28. Adding an external image to ggplots
Come and learn four different ways of adding an external image to ggplots to decorate your figure!
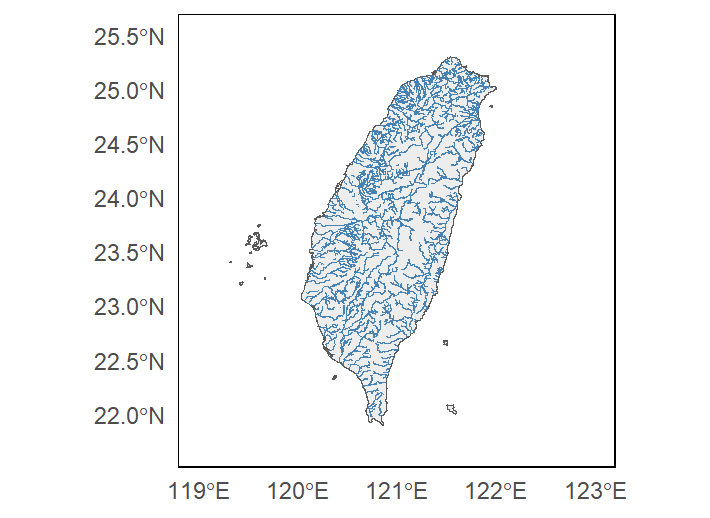
Post #27. ggplot Map Series No.3: Visualizing the veins of Taiwan in ggplots with `osmdata`
In this post, we will create a map of the rivers in Taiwan in ggplots using the package `osmdata`.
Post #26. ggplot Map Series No.2: Creating simple feature ggplot maps from shapefiles
Come and take a look at the nuts and bolts of creating simple feature maps from external shapefiles in ggplots!

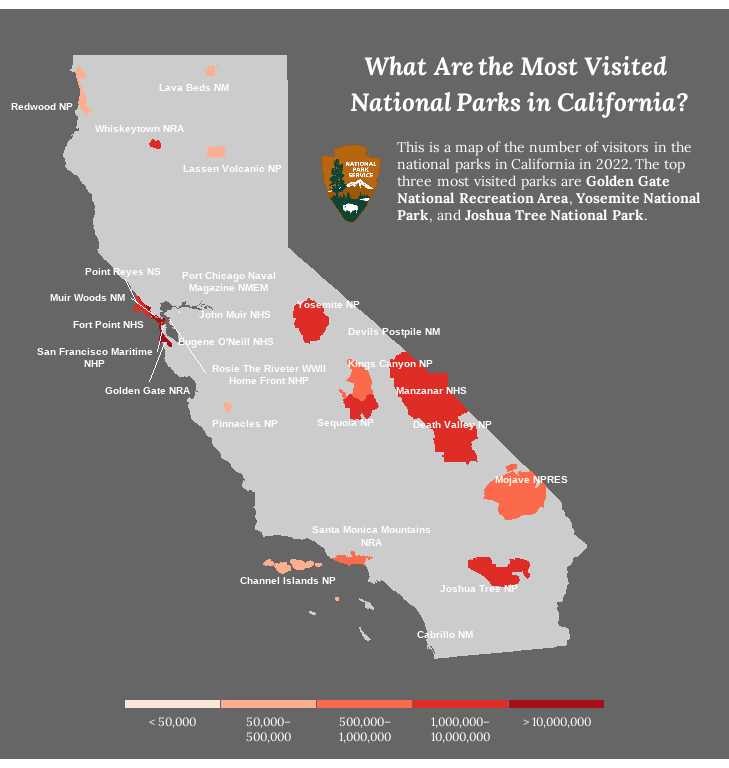
Post #25. ggplot Map Series No.1: Creating polygon maps in ggplots
In this post, you will learn about how to create basic polygon maps and choropleth maps in ggplots.
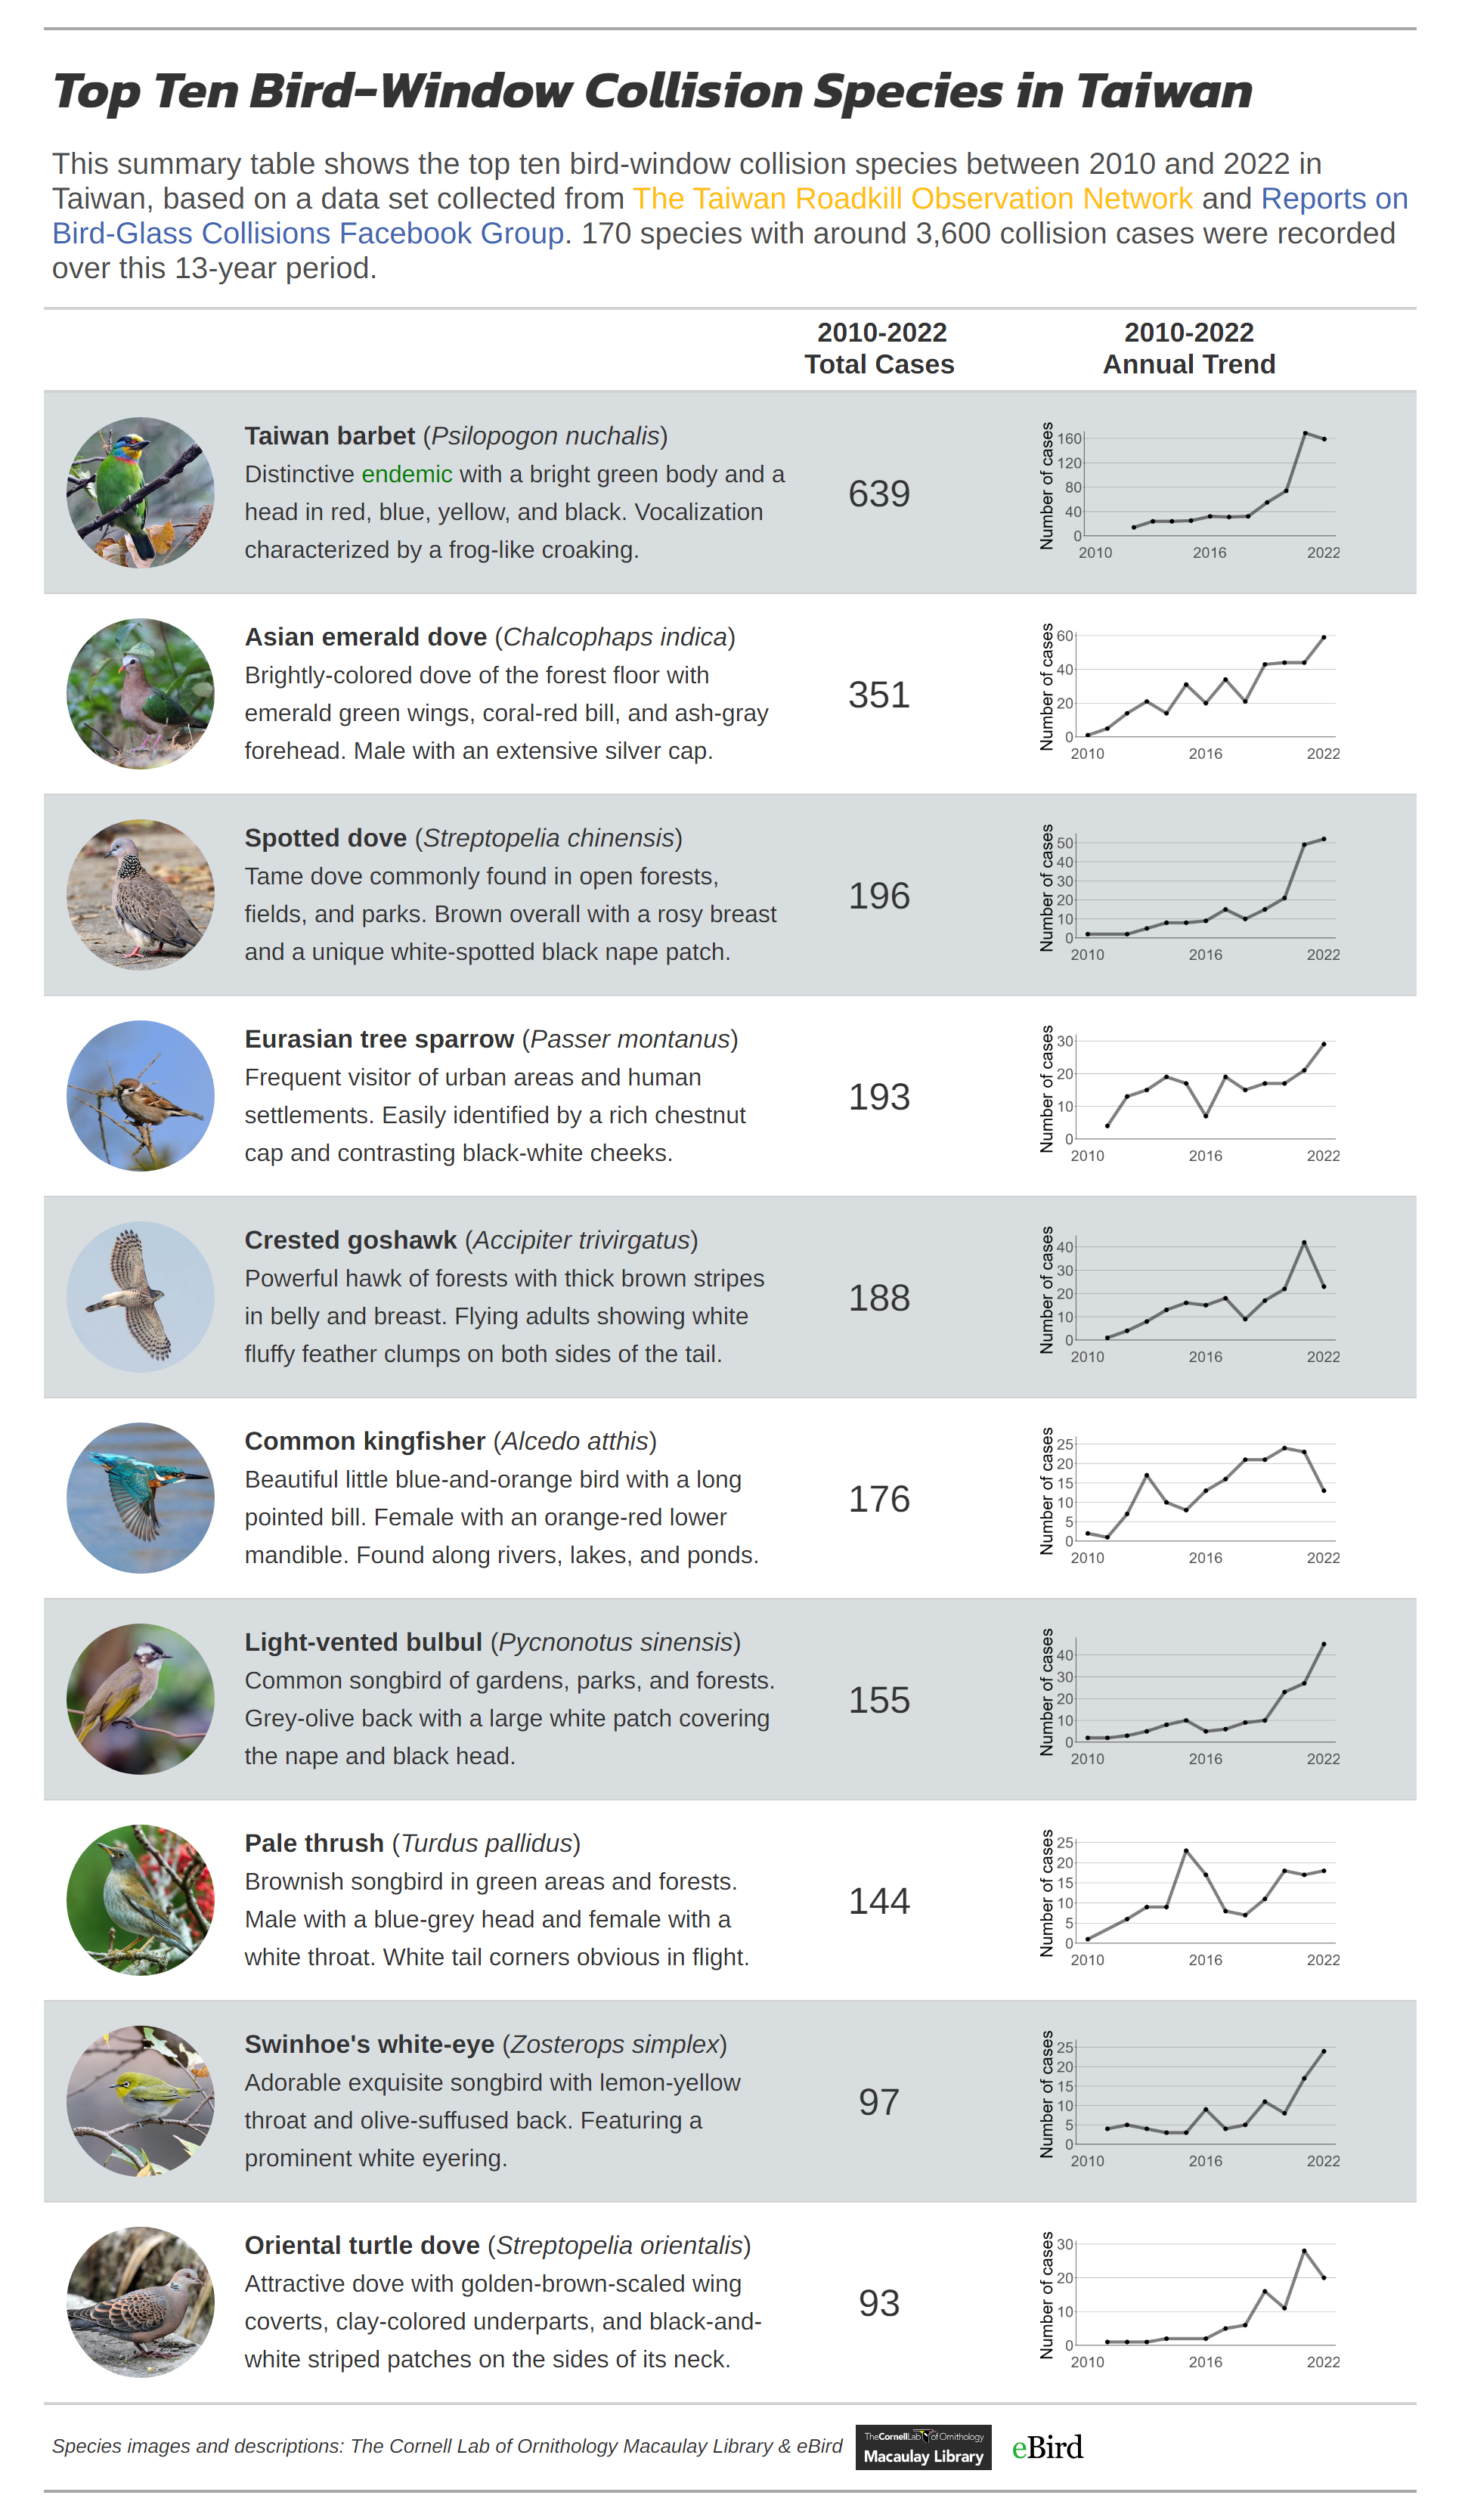
Post #24. The spark between gt and ggplot2: Visualizing the top ten bird-window collision species in Taiwan
An awesome integration of `gt` and `ggplot2` tells the story of the top ten bird-window collision species in Taiwan!

Post #23. ggplot Legend Tips Series No.8: The nuts and bolts of legend item spacing
Here are all the nuts and bolts you need for working on legend item spacing!
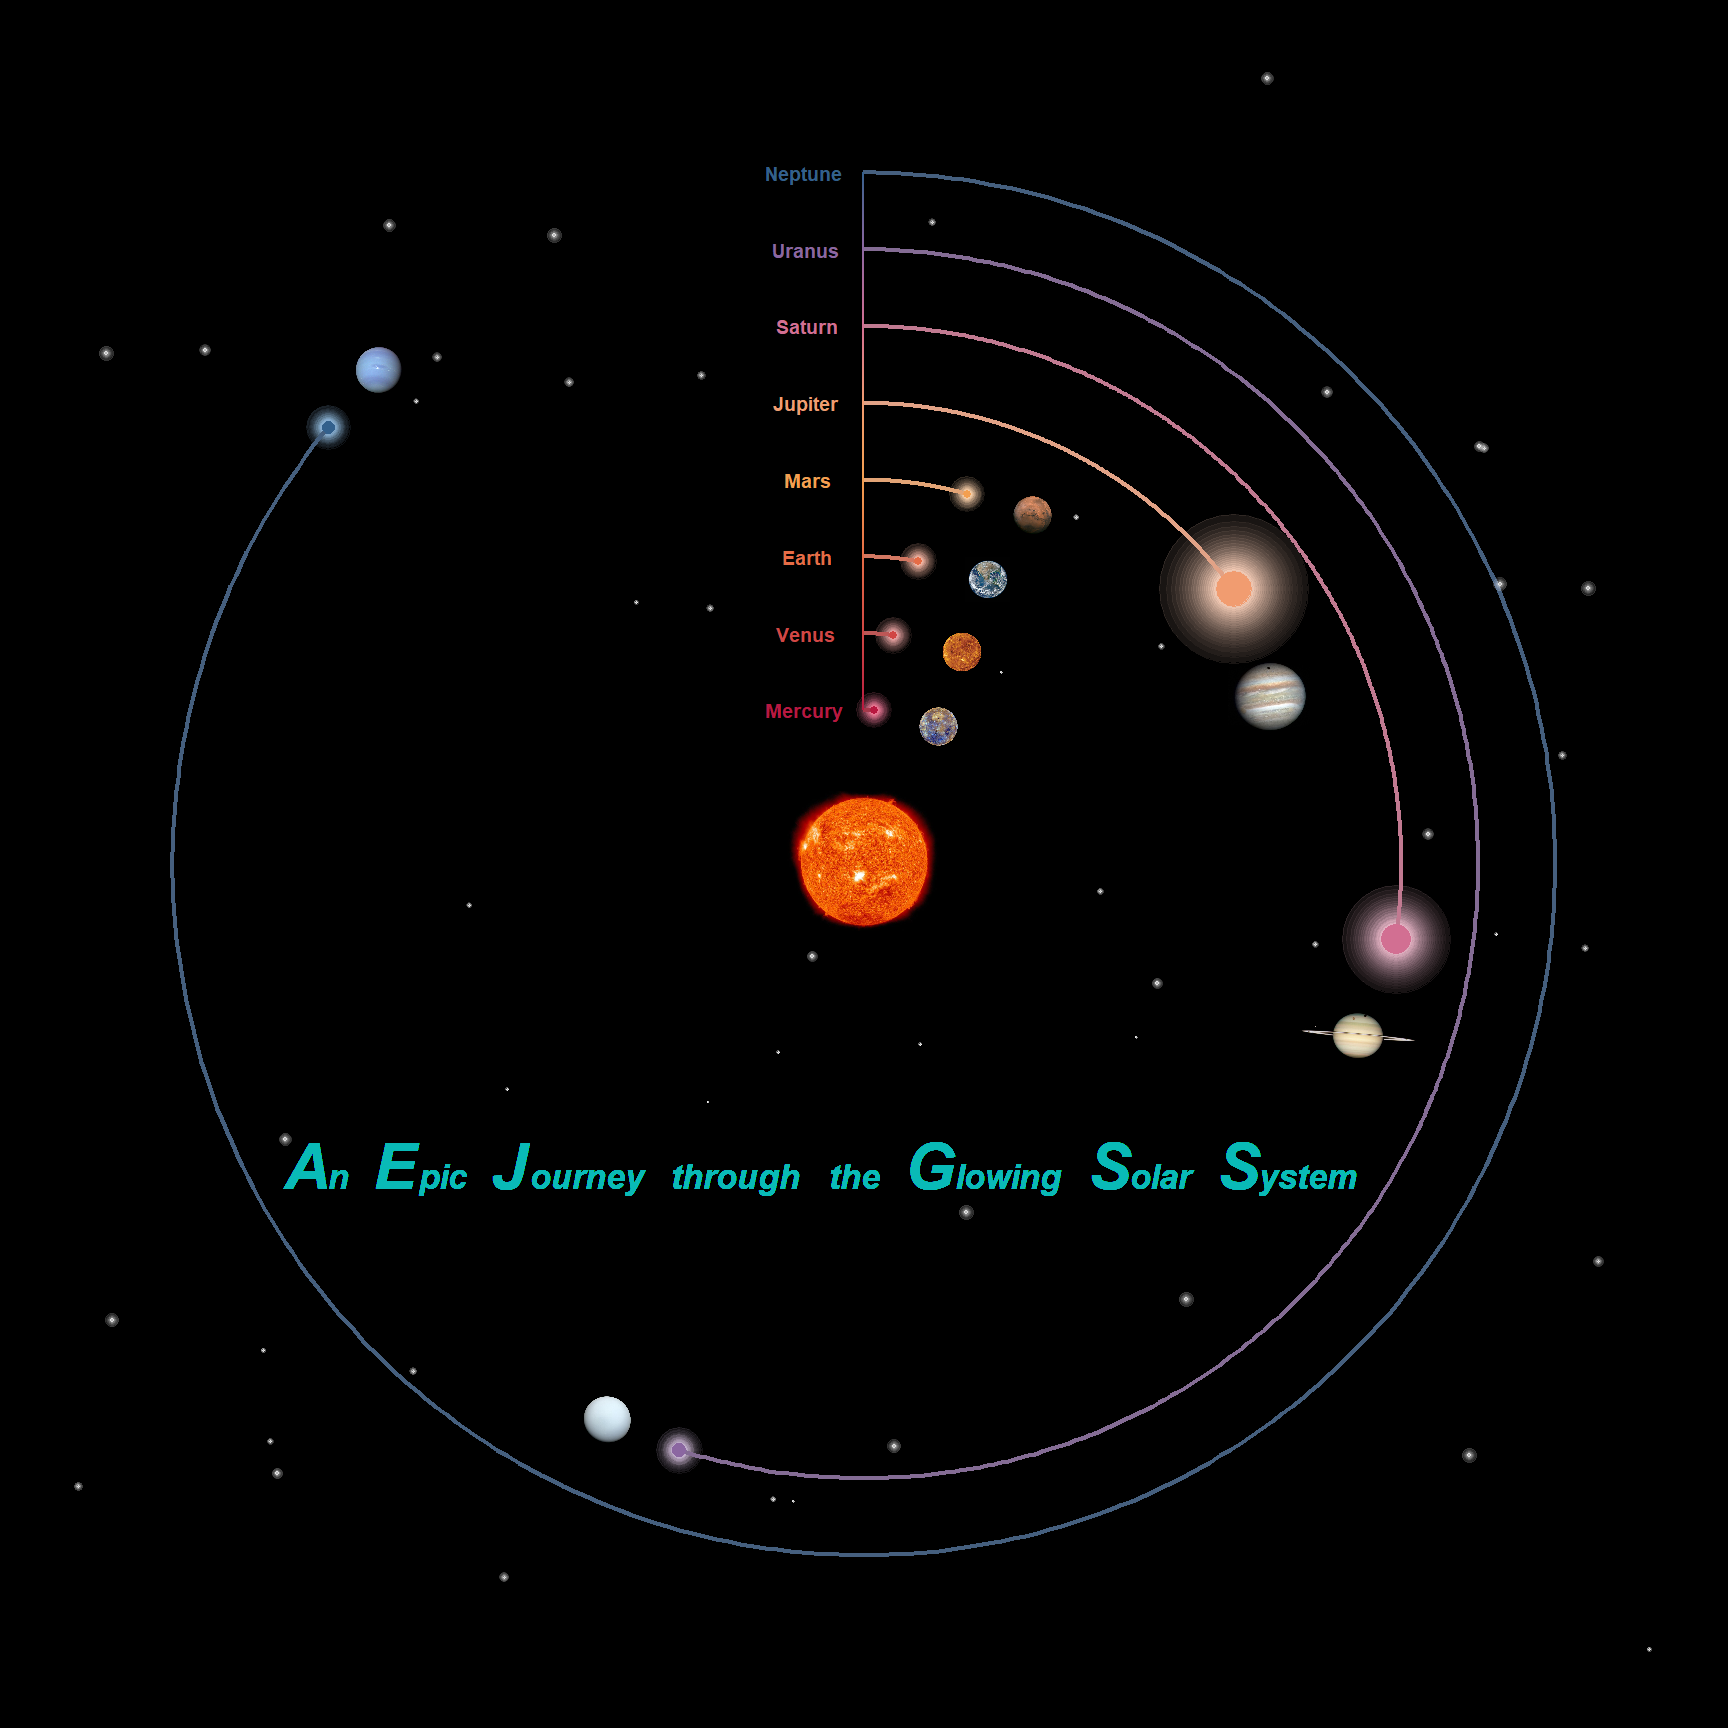
Post #22. An epic ggplot journey through the glowing solar system
Ready for an epic ggplot journey through the glowing solar system? Let's go!
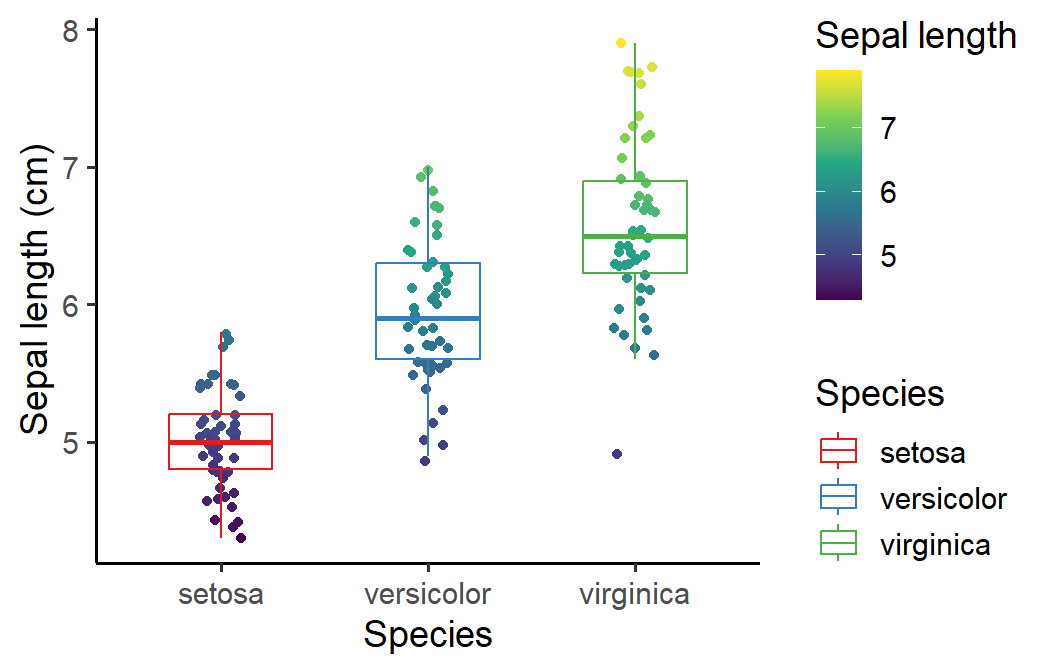
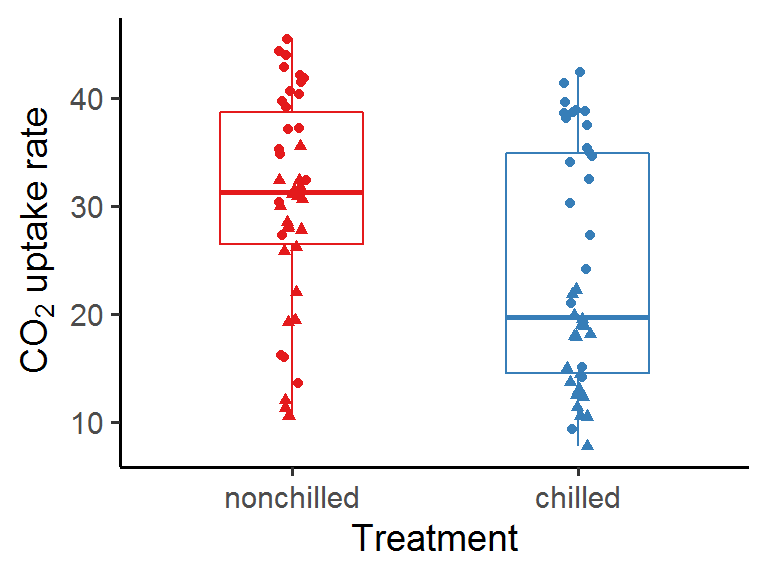
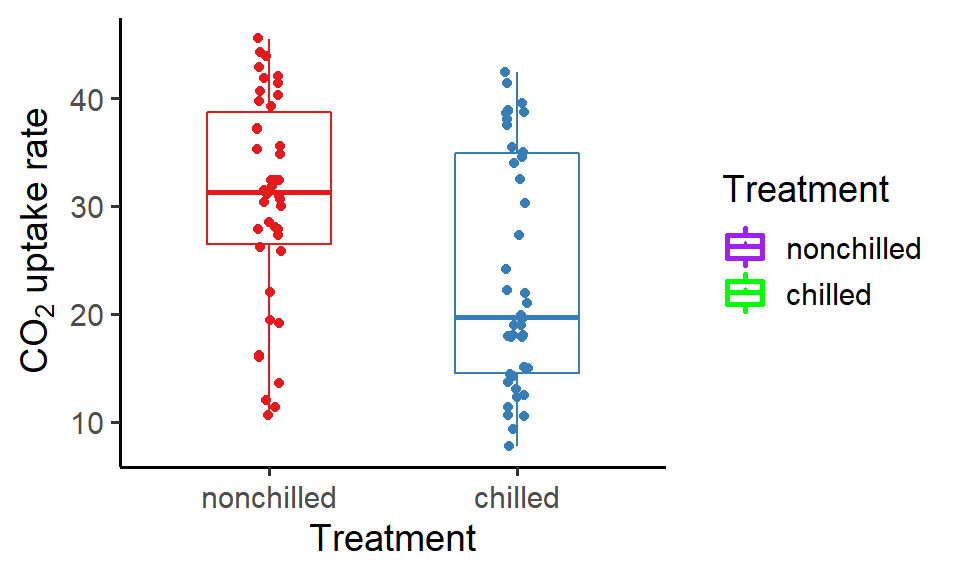
Post #21. Useful tips for mapping color and fill aesthetic in the same geom layer
In this quick post, I will show you how to use color and fill aesthetic together in the same geom layer to achieve the desired outcome!
Post #20. ggplot Legend Tips Series No.7: Working on legends with theme()
In this post, you will learn how to modify the appearance of ggplot legends using the arguments in `theme()`.
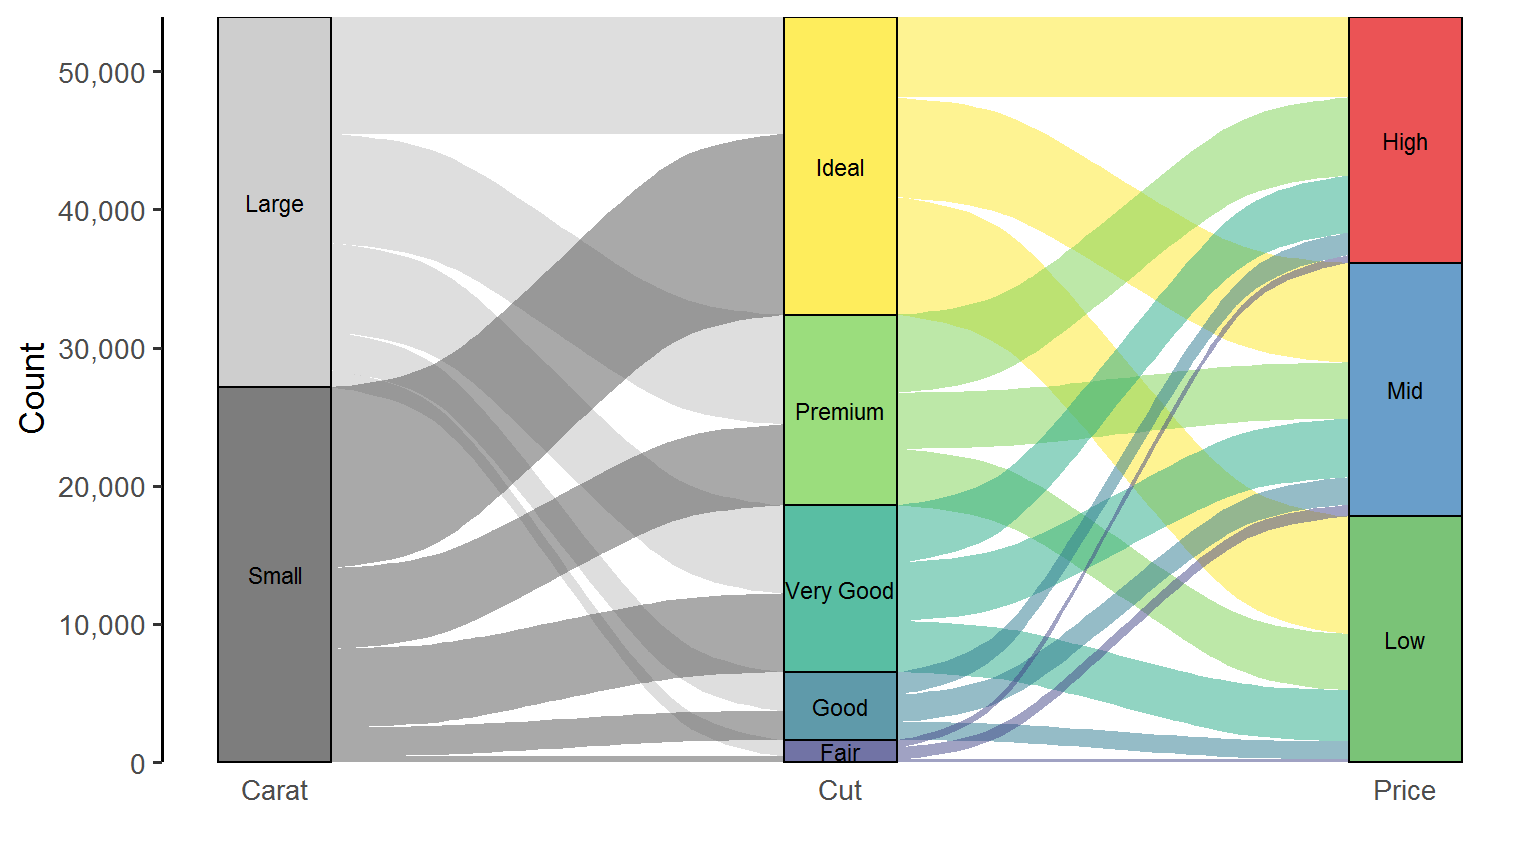
Post #19. Go with the flow - alluvial diagrams in ggplot
Let's make flowy alluvial diagrams in ggplot using the extension package `ggalluvial`!
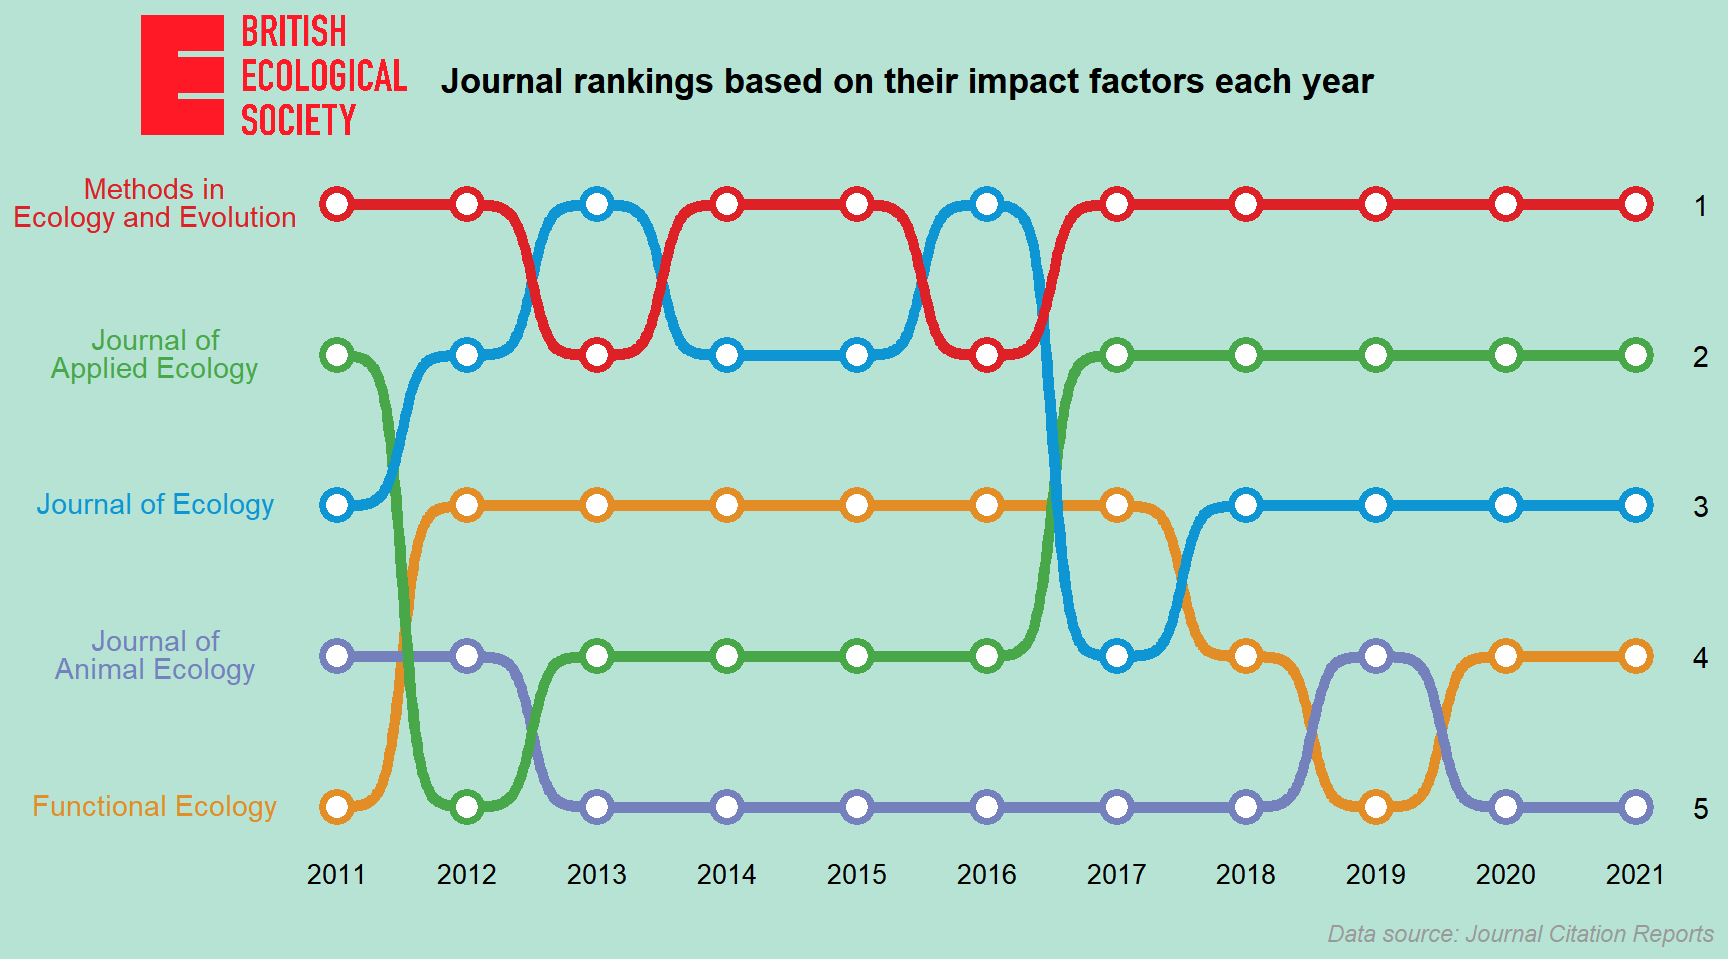
Post #18. Bump charts with ggplot
Come and learn how to create nice bump charts with ggplot!
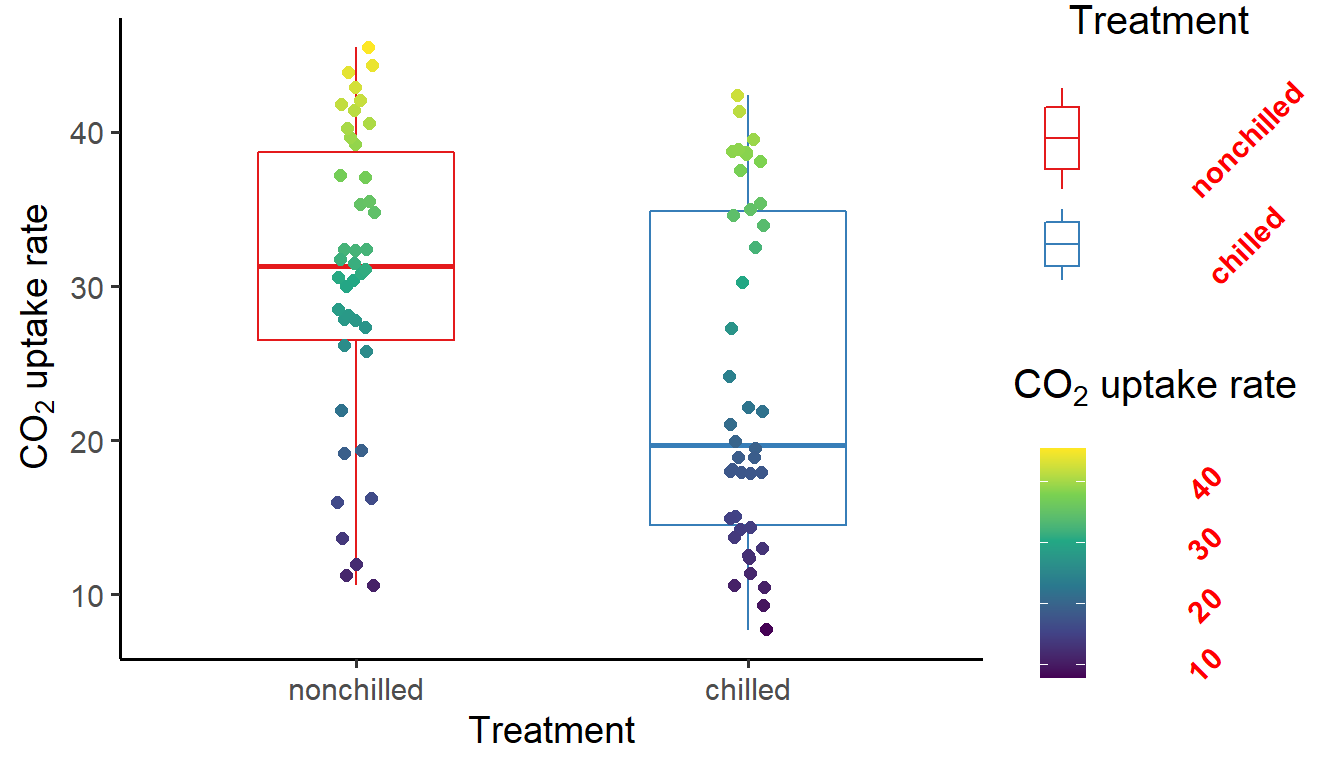
Post #17. ggplot Legend Tips Series No.6: Working on continuous legends with scale_XX functions
In this post, you will learn how to modify the appearance of continuous legends in ggplots using `scale_XX` family of functions.
Post #16. ggplot Legend Tips Series No.5: Working on discrete legends with scale_XX functions
In this post, you will learn how to modify the appearance of discrete legends in ggplots using `scale_XX` family of functions.
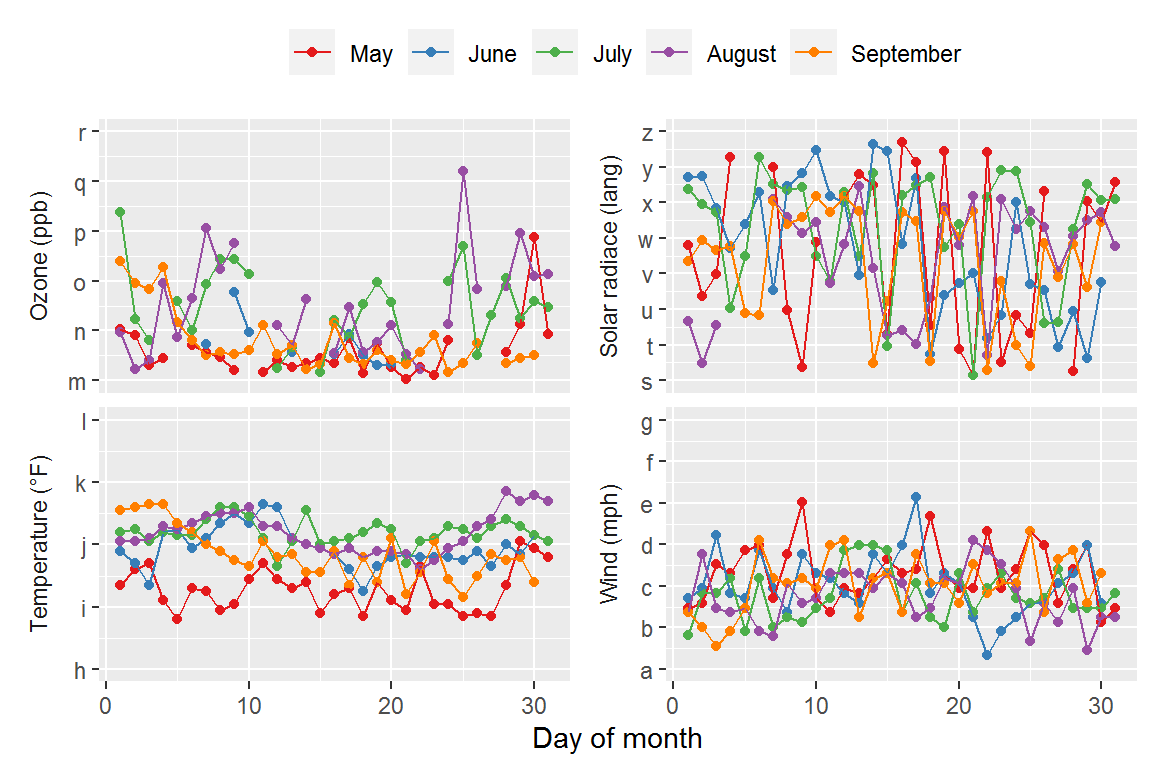
Post #15. Manipulating the axes for individual facets with `tidytext` and `ggh4x`
Bothered by the hassle of manipulating the axes for individual facets? This is the post for you!
Post #14. Multiple color scales in one ggplot
Using different color scales for multiple geom layers in one ggplot with `ggnewscale` and `relayer`
Post #13. ggplot Legend Tips Series No.4: Merging ggplot legends
Come and learn two handy tips to merge two ggplot legends into one!
Post #12. ggplot Legend Tips Series No.3: Three ways to turn off the legends in ggplots
Come and learn three handy tips to turn off the legends in ggplots!
Post #11. ggplot Legend Tips Series No.2: Working on continuous legends with guides()
In this post, you will learn how to tweak the appearance of continuous legends in ggplots with `guides()`.
Post #10. ggplot Legend Tips Series No.1: Working on discrete legends with guides()
In this post, you will learn how to tweak the appearance of discrete legends in ggplots with `guides()`.

Post #9. Arrange multiple ggplots on one graphic device
Come and learn two methods to arrange multiple ggplots on one graphic device.
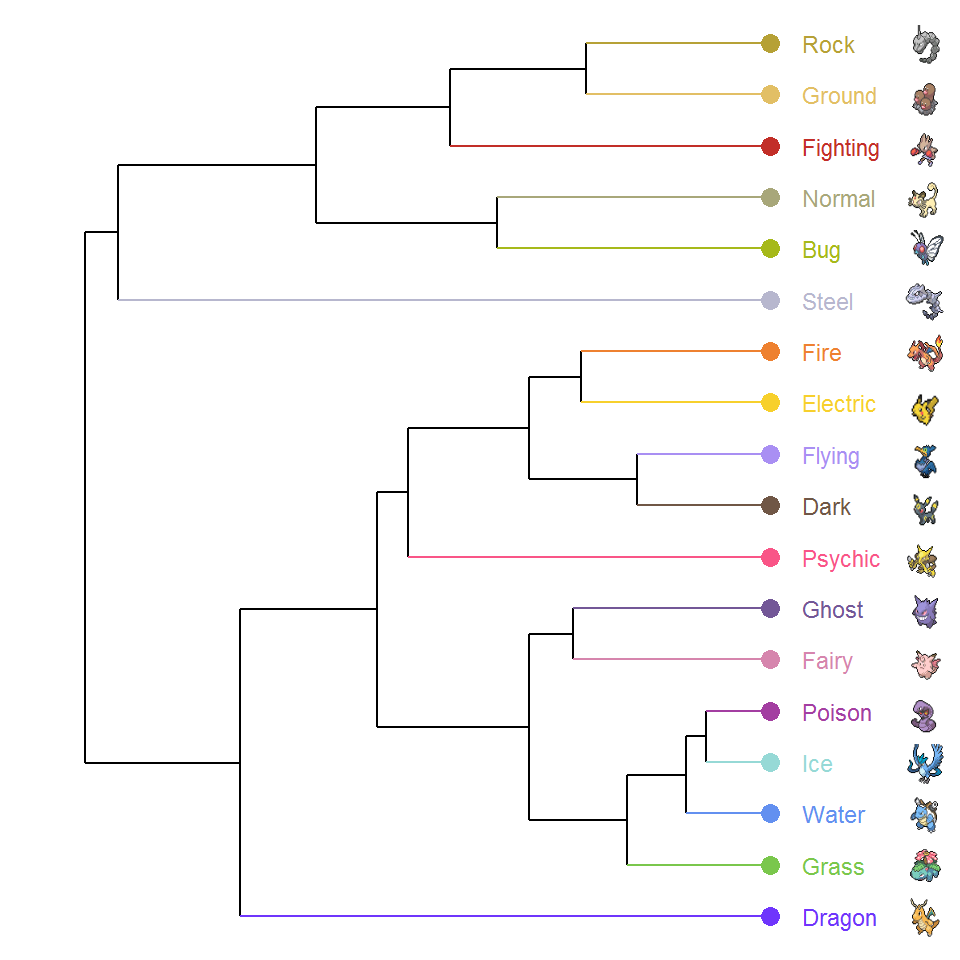
Post #8. Pokemon phylogeny with ggdendro
Create a Pokemon phylogenetic tree in ggplot with the extension package ggdendro.
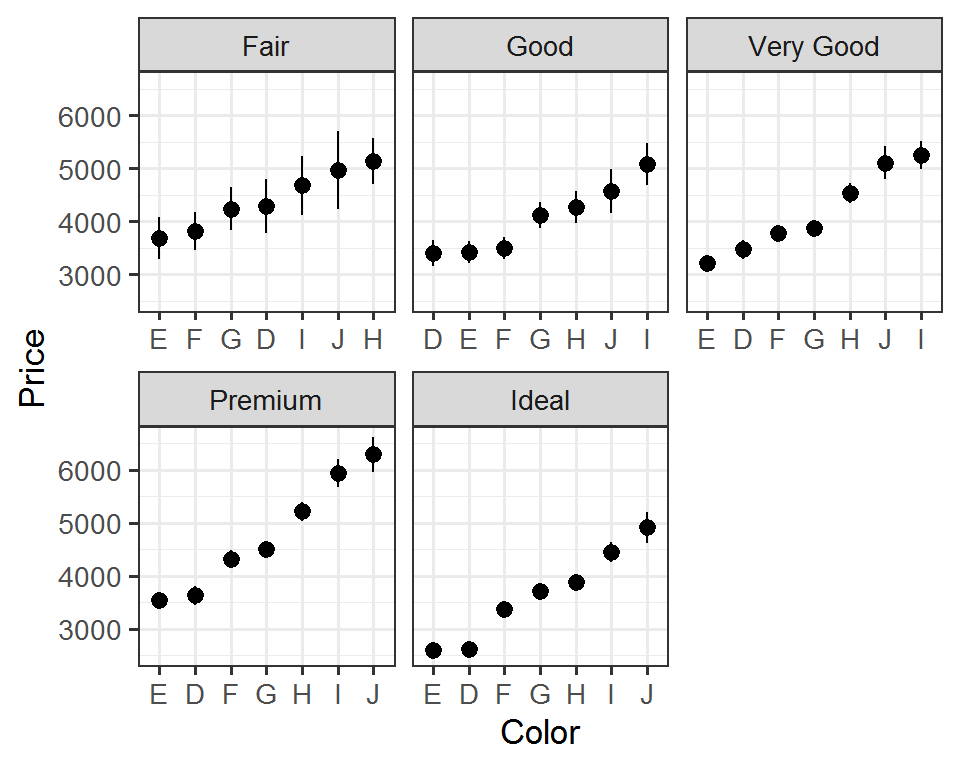
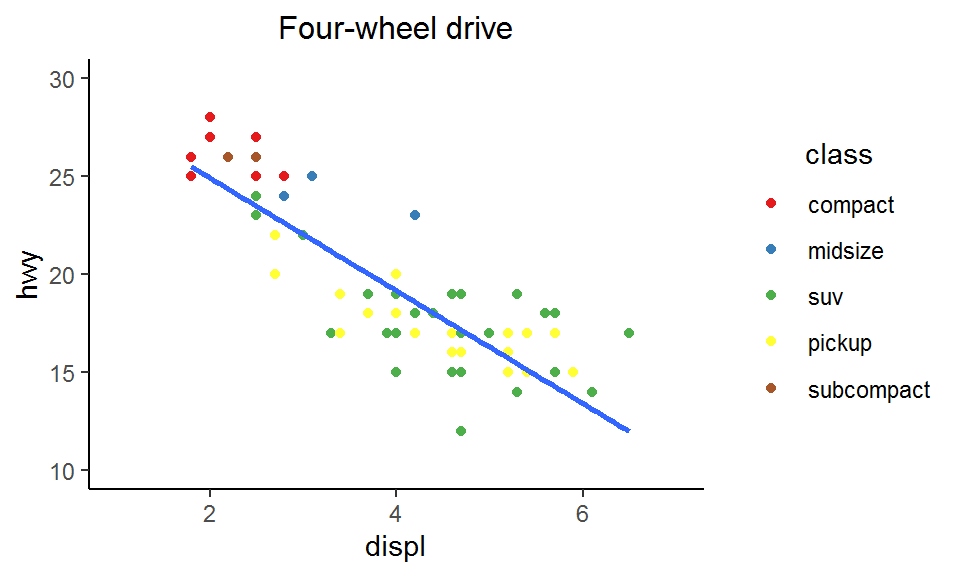
Post #7. Customize the axis scales for individual ggplot facets
Come and learn how to customize the axis scales (axis limits, tick breaks, and tick labels) for individual ggplot facets!
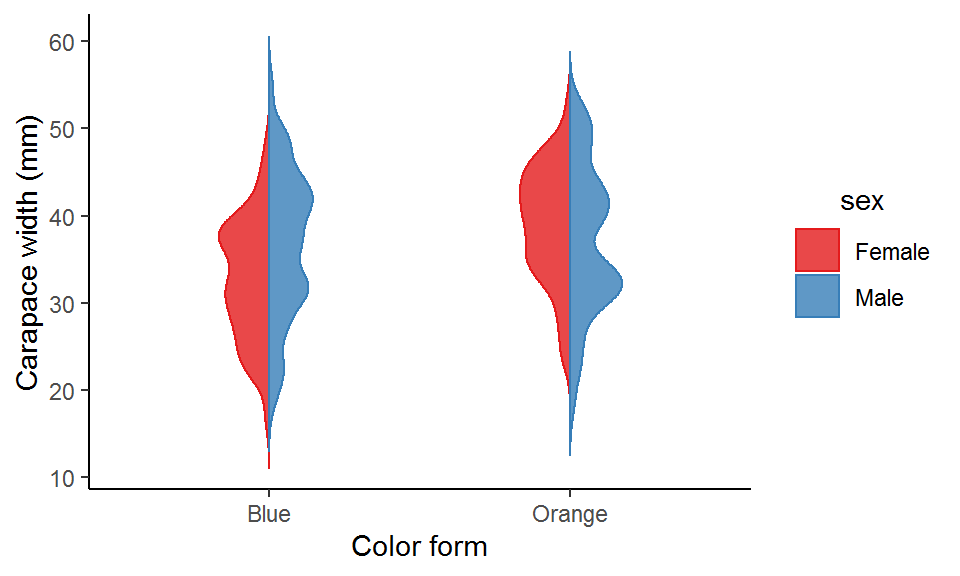
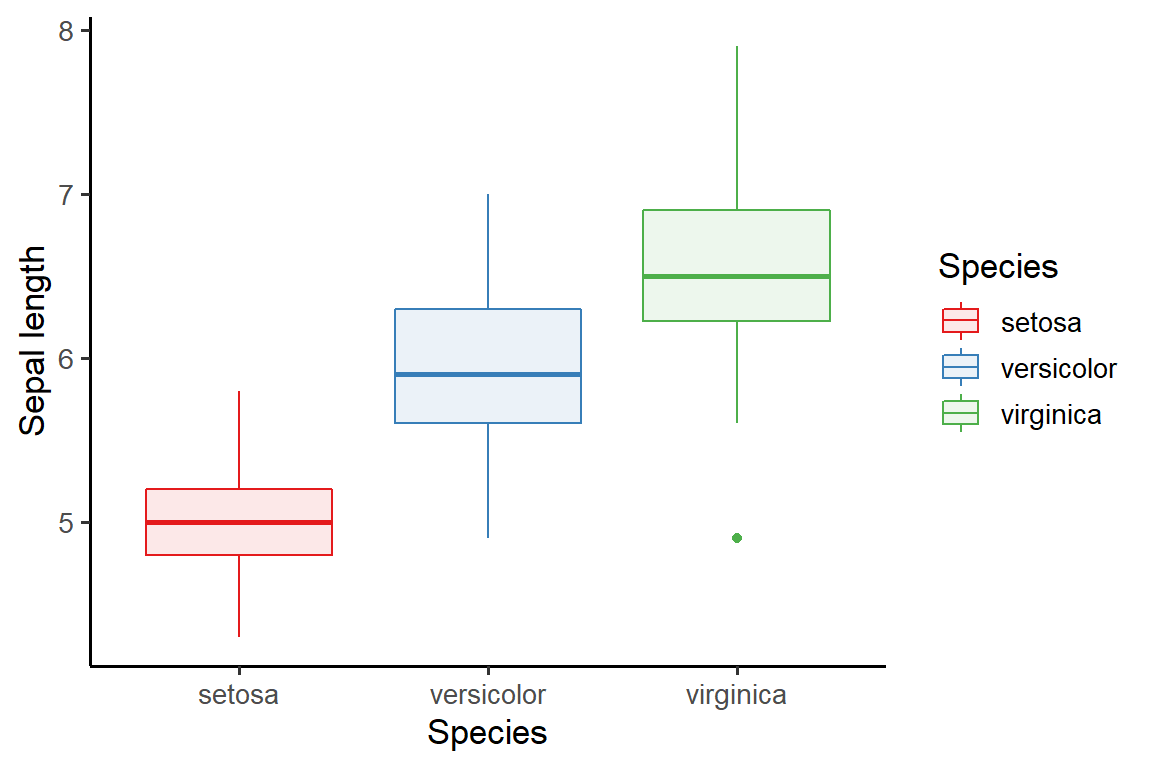
Post #6. Play good music for your data - violin plots with ggplot
Visualize data distributions using violin plots with ggplot.
Post #5. Awesome text displays with ggtext
Enhance text displays in your ggplots with the extension package ggtext!
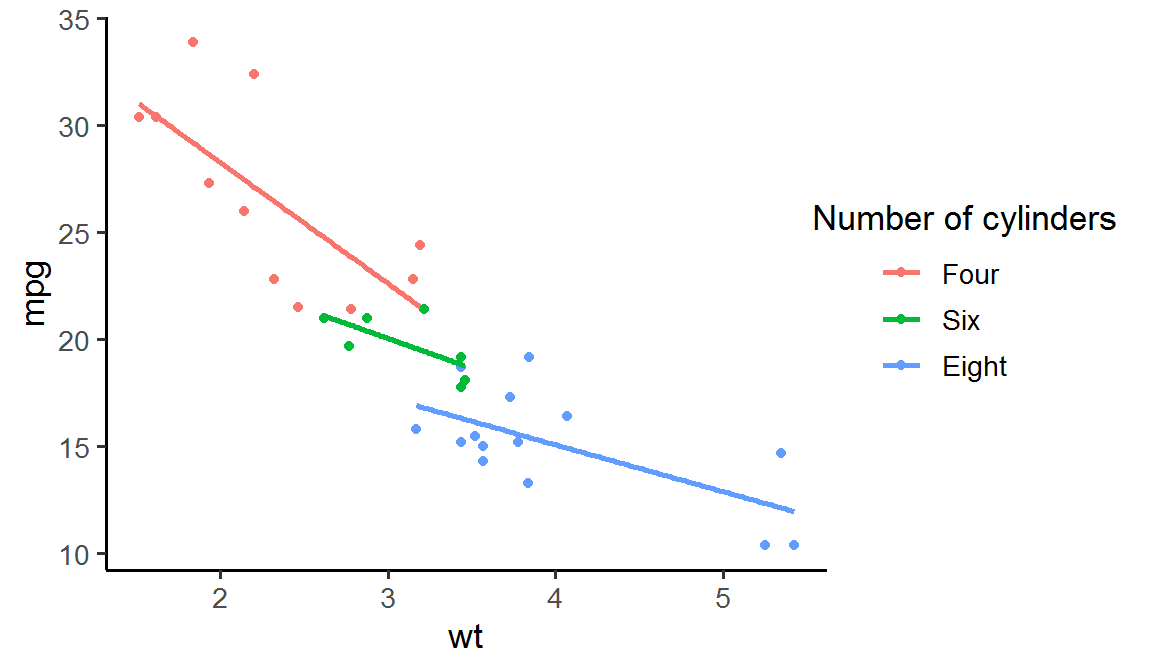
Post #4. Consistent colors of the same factor levels across figures
In this post, I will show you a simple trick to keep the colors of the same factor levels consistent across different ggplot figures.
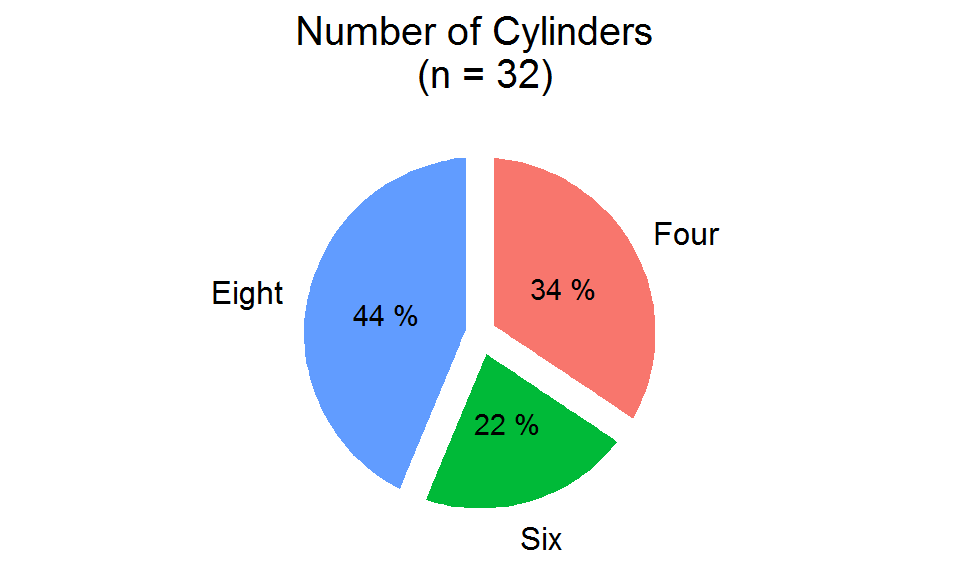
Post #3. Pie charts with ggplot
Want to know how to create effective pie charts with ggplot? Dig in to learn more!
Guest Post #1. Communicating the ESSENCE of your data
Visualizing multi-dimensional and dynamic data can be challenging. In this post, I will show how you can better communicate these features with interactive plots and animations.
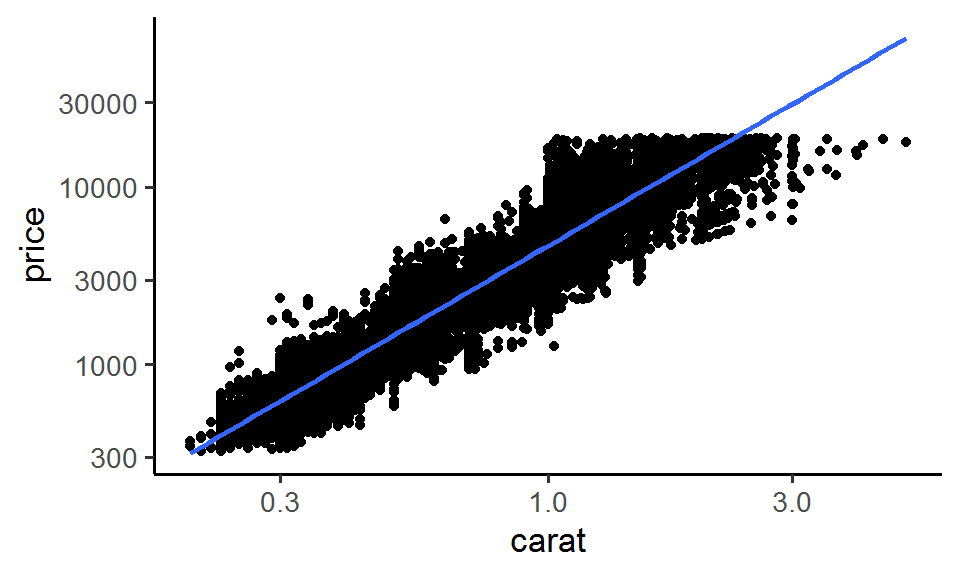
Post #2. Three ways to create log axes in ggplots: which one should you use?
This post shows you three different ways to create log axes in ggplots and provides some suggestions on which method to use for your figures.
Post #1. Center long legend titles in ggplots
In this post, I will show you a simple quick hack to center long legend titles in ggplots without bothering gtables and grobs.
