Introduction
Sometimes, we would like to put an image, an illustration, or a silhouette in the figure to make it more visually appealing. How can we do this in ggplots? Well, this is actually not difficult at all. In this post, I’m going to introduce four ways of adding an external image to ggplots. Read below!
Four ways of adding an external image to ggplots
(1) The package ggimage
The extension package ggimage has a function geom_image() that draws images on ggplots. Simply specify the x- and y-coordinates and map the image (either a local file path or an url) to the “image” argument and you’re all set!
library(tidyverse)
library(ggimage)

### The url of an iris image
image_url <- "https://images.phylopic.org/images/0a8ab4f9-04c9-4485-b21a-df683d506055/raster/222x512.png"

### The boxplot with an iris image added
ggplot(iris, aes(x = Species, y = Sepal.Length, color = Species)) +
  geom_boxplot() +
  geom_image(aes(x = 1, y = 7.1, image = image_url), size = 0.11, color = "purple") +
  scale_color_brewer(palette = "Set1") +
  theme_classic(base_size = 13)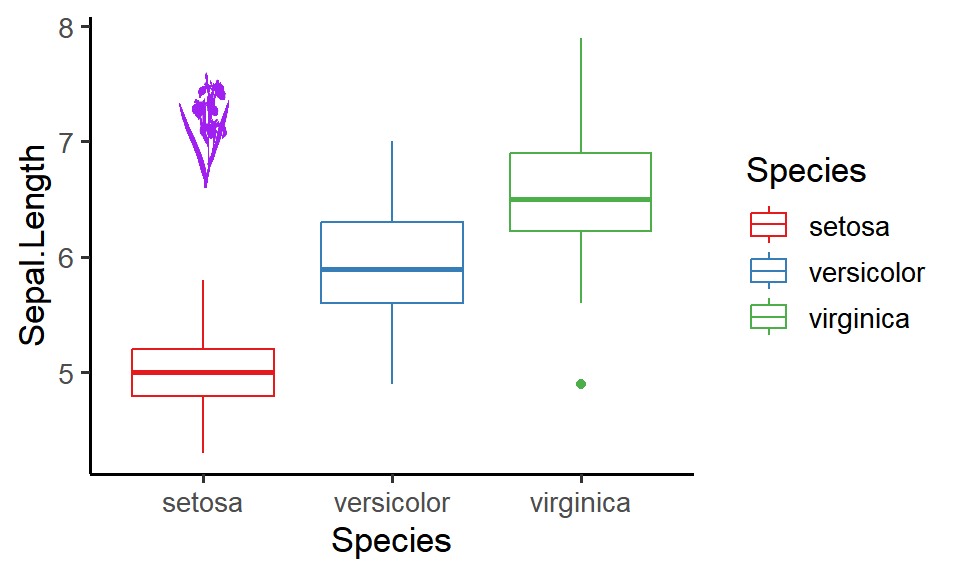
We can also use the image as points for the scatterplot:
ggplot(iris, aes(x = Sepal.Length, y = Sepal.Width)) +
  geom_image(aes(image = image_url, color = Species), size = 0.03) +
  scale_color_brewer(palette = "Set1") +
  theme_classic(base_size = 13)
(2) The package ggtext
ggtext is another extension package that we can use to add images to ggplots, yet the way how ggtext does it is a bit different from ggimage: instead of directly specifying the image path in aes(), we need to wrap the image path into an HTML <img> tag and use the function geom_richtext(label = ) to render the tag into an actual image for plotting. The size of the image can be controlled using the “width” or “height” attribute in the <img> tag. There’s one limitation though: you can’t change the color of the image as you did earlier.
library(tidyverse)
library(ggtext)

### Create an HTML <img> tag
image_tag <- "<img src = 'https://images.phylopic.org/images/0a8ab4f9-04c9-4485-b21a-df683d506055/raster/222x512.png' width = '19'/>"

### The boxplot with an iris image added
ggplot(iris, aes(x = Species, y = Sepal.Length, color = Species)) +
  geom_boxplot() +
  geom_richtext(aes(x = 1, y = 7.1, label = image_tag), color = NA) +  # specify "color = NA" to remove the outline box
  scale_color_brewer(palette = "Set1") +
  theme_classic(base_size = 13)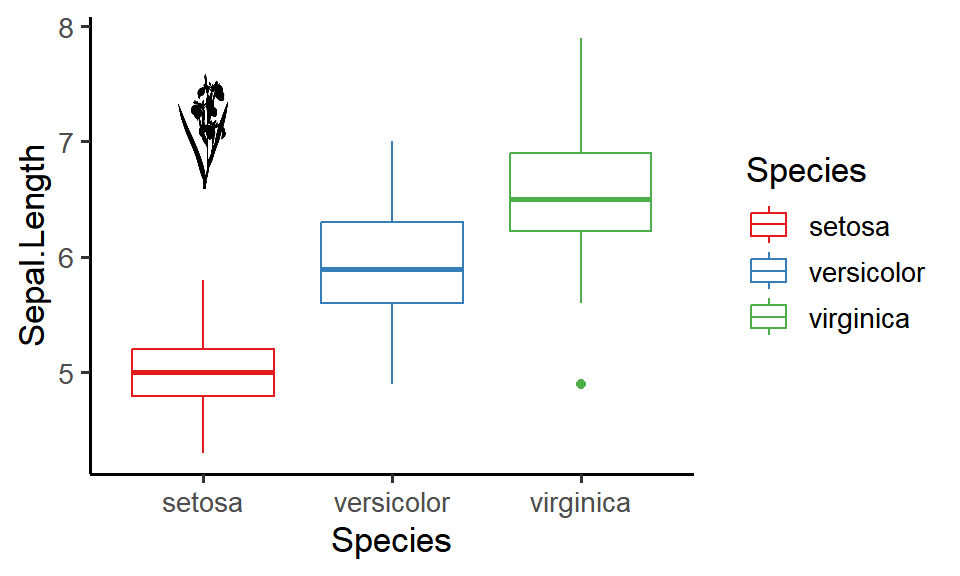
As a side note, you can use ggtext to modify the labels and text in ggplots in a more sophisticated and customized manner. Check out my previous post on using ggtext for awesome text displays in ggplots!
(3) The package cowplot
The third extension package that we can use to add an image to ggplots is cowplot. The basic idea is that we will first create a drawing canvas using the function ggdraw(), and then we can add plots (using the function draw_plot()) or images (using the function draw_image()) to the canvas. The canvas has x- and y-coordinates between 0 and 1, and we can specify the image position using relative coordinates. It does require some experimentation to tweak the image position! Setting “hjust = 0.5” and “vjust = 0.5” will make the center of the image at the point of the specified x- and y-location.
library(tidyverse)
library(cowplot)

### The url of an iris image
image_url <- "https://images.phylopic.org/images/0a8ab4f9-04c9-4485-b21a-df683d506055/raster/222x512.png"

### The boxplot
iris_boxplot <- ggplot(iris, aes(x = Species, y = Sepal.Length, color = Species)) +
  geom_boxplot() +
  scale_color_brewer(palette = "Set1") +
  theme_classic(base_size = 13)

### Draw the boxplot and image on the canvas
ggdraw() +
  draw_plot(iris_boxplot) +  # the plot will take up the entire canvas space by default
  draw_image(image_url, x = 0.21, y = 0.77, scale = 0.2, hjust = 0.5, vjust = 0.5)  # use the argument "scale" to adjust the size of the image
(4) The package patchwork
The last extension package is patchwork, which is an awesome package for arranging multiple ggplots. The package has a function inset_element() that draws plots (“grob” or “ggplot” objects) or images (“raster” objects) as insets. To do so, we’ll first read in the iris image using the function image_read() from the package magick and convert it to a raster object using the function as.raster(). After that, we can pass the raster image to inset_element() to add it to the boxplot as an inset. The position and the size of the inset are controlled by the locations of the vertices (“left”, “bottom”, “right”, “top”), and we need to experiment a bit to get the inset at the exact position with the desired size.
library(tidyverse)
library(patchwork)

### The url of an iris image
image_url <- "https://images.phylopic.org/images/0a8ab4f9-04c9-4485-b21a-df683d506055/raster/222x512.png"

### Read in the image as a raster object
library(magick)
image_raster <- image_read(image_url) %>% as.raster()

### The boxplot
iris_boxplot <- ggplot(iris, aes(x = Species, y = Sepal.Length, color = Species)) +
  geom_boxplot() +
  scale_color_brewer(palette = "Set1") +
  theme_classic(base_size = 13)

### Add the image to the boxplot as an inset
iris_boxplot + inset_element(image_raster, left = 0.13, bottom = 0.62, right = 0.24, top = 0.92)
Summary
In this post, we looked at four different extension packages that we can use to add an image to ggplots. You may ask: which one should I use? Well, I would say they’re pretty much similar in most cases, so simply pick the one that’s down your alley! If you want to do something further (e.g., change the image color), then look for a certain package (e.g., ggimage) that has the functionality you need.
Hope you learn something useful from this post and don’t forget to leave your comments and suggestions below if you have any!
