Background
This is the part II of the previous
post where I introduced how one can adjust the discrete legends in
ggplots using the scale_XX family of functions. In this
post, I’m going to talk about adjusting continuous legends, again using
the scale_XX functions.
An example with scale_fill_gradient()
Let’s start with an example plot of eruption time vs. waiting time of
the old faithful geyser using the faithful
dataset. In the below code chunk, the function geom_hex()
divides the plot panel into a grid of hexagons, counts the number of
original data points in each hexagon, and maps the counts to the “fill”
aesthetic. This is a useful way to avoid overlapping points (i.e.,
overplotting), especially when the dataset is huge.
library(tidyverse)

ggplot(faithful, aes(x = eruptions, y = waiting)) +
  geom_hex(aes(fill = ..count..)) +  # hexagon bins
  labs(x = "Eruption time (min)", y = "Waiting time (min)") +
  theme_classic(base_size = 13)
Now we can try to adjust the legend bar using the arguments in
scale_fill_gradient(). Three main things to change are:
(1)
Legend range, controlled by the argument limits
(2)
Legend tick positions, controlled by the argument breaks
(3) Legend
tick labels, controlled by the argument labels
ggplot(faithful, aes(x = eruptions, y = waiting)) +
  geom_hex(aes(fill = ..count..)) +
  scale_fill_gradient(name = "Number of \n eruptions",
                      limits = c(0, 6),  # legend range
                      breaks = c(1, 2, 3, 4, 5),  # legend tick positions
                      labels = format(c(1, 2, 3, 4, 5), nsmall = 1)) +  # legend tick labels
  labs(x = "Eruption time (min)", y = "Waiting time (min)") +
  theme_classic(base_size = 13)
We can also cut the legend bar into several bins by using the
argument guide = guide_colorsteps():
ggplot(faithful, aes(x = eruptions, y = waiting)) +
  geom_hex(aes(fill = ..count..)) +
  scale_fill_gradient(name = "Number of \n eruptions",
                      limits = c(0, 6),
                      breaks = c(1, 2, 3, 4, 5),
                      labels = format(c(1, 2, 3, 4, 5), nsmall = 1),
                      guide = guide_colorsteps()) +  # cut the legend bar into bins
  labs(x = "Eruption time (min)", y = "Waiting time (min)") +
  theme_classic(base_size = 13)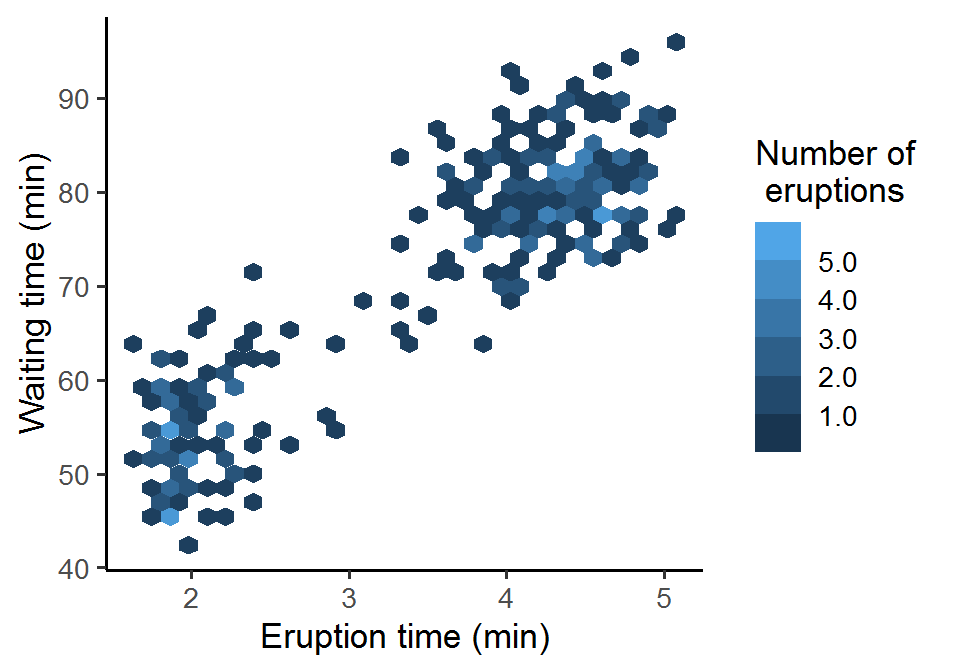
Summary
In this post, we’ve seen how to adjust a continuous legend via the
arguments in scale_fill_gradient(): limits for
setting the range of the legend bar, breaks for drawing the
legend ticks, and labels for adding the tick labels. We can
also convert the continuous legend bar into a discrete one by specifying
guide = guide_colorsteps().
Hope you learn something useful from this simple post and don’t forget to leave your comments and suggestions below if you have any!
