Introduction
When we map a variable to an aesthetic (e.g., color), ggplot will automatically create a legend for it, which is quite convenient. However, sometimes we may want to hide the legend (maybe the information there is redundant to the plot itself). This is actually pretty easy, and in this post I will show you three ways to do so, each for different purposes and with different effects:
(1) Hide the legend for a geom layer (2) Hide the legend for an aesthetic mapping (3) Hide all the legends in the figure
Let’s make an example figure first and we’ll walk through the three methods one by one.
library(tidyverse)

P <- ggplot(data = CO2) +
  geom_boxplot(aes(x = Treatment, y = uptake, color = Treatment), width = 0.5) +
  geom_point(aes(x = Treatment, y = uptake, color = Treatment, shape = Type), position = position_jitter(width = 0.05)) +
  labs(x = "Treatment", y = expression(paste(CO[2], " uptake rate"))) +
  theme_classic(base_size = 14) +
  scale_color_brewer(palette = "Set1")

P

(1) Hide the legend for a geom layer
Suppose that we want to remove all the points and keep only the boxes in the legend. We can do so by specifying show.legend = F in the corresponding geom layer (in this case geom_point()):
ggplot(data = CO2) +
  geom_boxplot(aes(x = Treatment, y = uptake, color = Treatment), width = 0.5) +
  geom_point(aes(x = Treatment, y = uptake, color = Treatment, shape = Type), position = position_jitter(width = 0.05), show.legend = F) +
  labs(x = "Treatment", y = expression(paste(CO[2], " uptake rate"))) +
  theme_classic(base_size = 14) +
  scale_color_brewer(palette = "Set1")
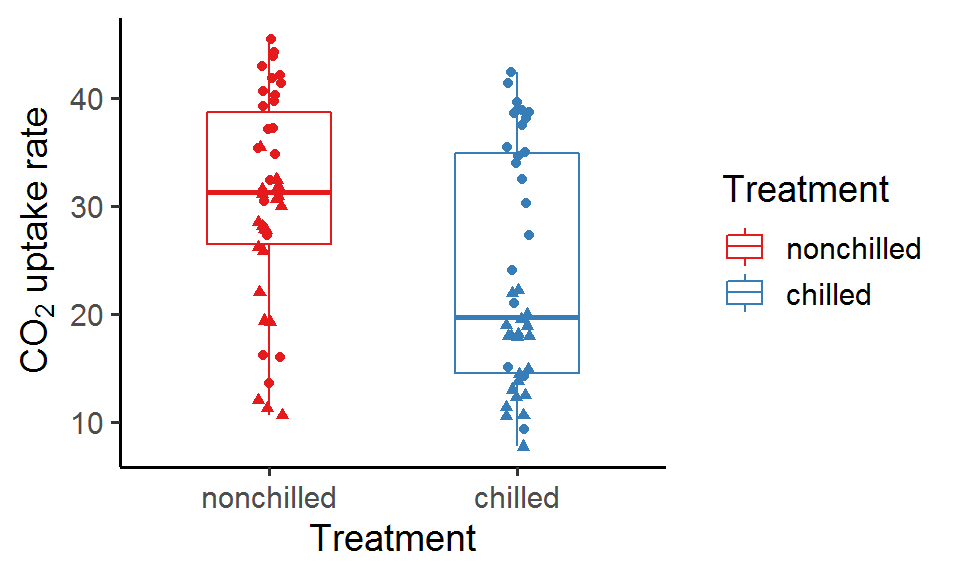
As you can see, all the points in the legend (including the ones in the boxes) are now gone and only the boxes are left.
(2) Hide the legend for an aesthetic mapping
Looks like the legend for “color” aesthetic in the original figure is a bit redundant: we’ve already known from the main plot that red represents “nonchilled” and blue represents “chilled”. On the other hand, we need the legend for “shape” aesthetic to show the site information (Quebec vs. Mississippi), which is not present in the plot. So is it possible to remove the legend for color but keep the one for shape? Of course it is! Just specify "none" for the aesthetic you want to remove (here color) in guides():
P + guides(color = "none")
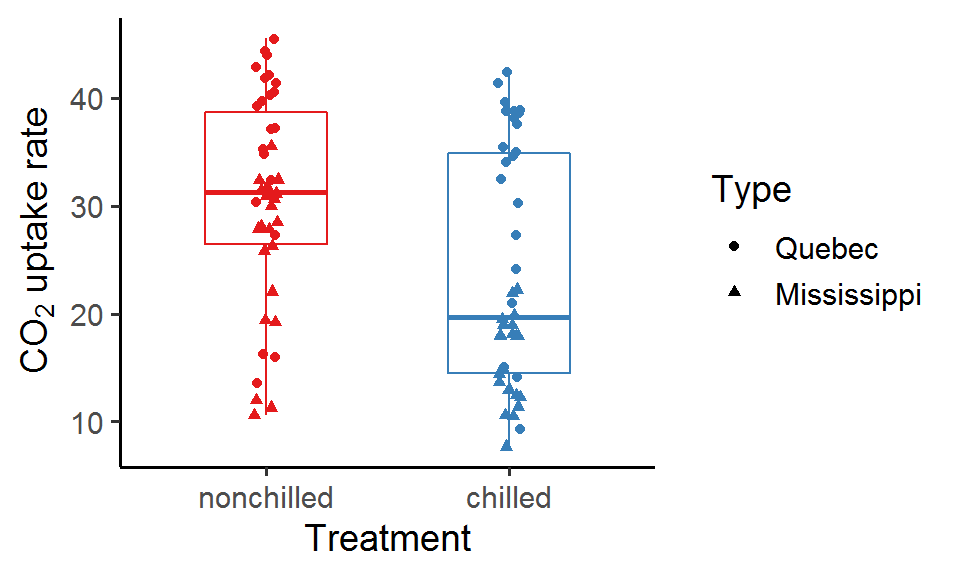
We’ve removed the legend for color and kept the shape. Great!
(3) Hide all the legends in the figure
The last method to hide the legend is to specify legend.position = "none" in theme() (which literally means no place for the legend). This will remove all the legends in the figure:
P + theme(legend.position = "none")

Summary
To recap, we’ve learned three ways to turn off ggplot legends: (1) by geom layer, (2) by aesthetic mapping, and (3) all legends together. For figures with a single geom layer and aesthetic mapping, all three methods will give the same results. For figures with more complex legends, they will generate different effects and it would be helpful to think about what the legend should look like and use the above principles to customize your legend.
Hope you enjoy the reading and don’t forget to leave your comments and suggestions below if you have any!
